It's amazing how much you can learn from a single chart sometimes.
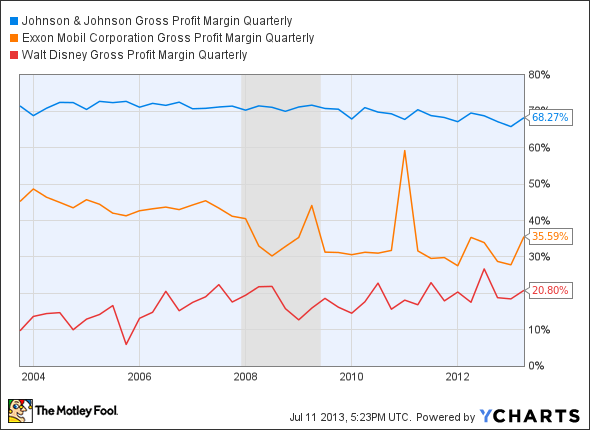
Take a look at the picture below. You'll find the recent gross-margin trends for three Dow Jones (DJINDICES: ^DJI ) members. They tell three very different stories that speak volumes about the business models involved.

JNJ Gross Profit Margin Quarterly data by YCharts. Shaded areas indicate U.S. recessions.
Let's start with pharmaceutical and consumer goods giant Johnson & Johnson (NYSE: JNJ ) , sliding along at the top of the chart.
J&J didn't care much about the recession. When you're dealing in consumer goods -- and commoditized ones at that -- the economic landscape doesn't seem to matter much. No matter the size of your paycheck, you still need day-to-day staples like first-aid medications and baby shampoo.
This means that demand for Johnson & Johnson's core products will always be fairly stable, come hell or high water. The stock may not be a barn-burning growth vehicle, but you can stick this share under your pillow and sleep soundly for decades. The Dow has returned a dividend-adjusted 5.1% per year over the last two decades. J&J shares have soared 14.1% a year in the same period.
Walt Disney (NYSE: DIS ) is another consumer-facing titan, but with a twist. Disney's gross margin has increased dramatically in the last decade, and never you mind that silly recession.
Family entertainment may not be a necessity like basic health-care items, but Disney's brand power overrides that potential weakness. On top of that, the House of Mouse has made a number of astute acquisitions in recent years -- household brands such as Marvel, Pixar, and Lucasfilm. Careful stewardship of that growing content library helps Disney raise prices on movie licenses, cruise tickets, and theme park passes without scaring away customers.
Our final ticker today is oil and gas giant ExxonMobil (NYSE: XOM ) . America's largest petroleum-pumper runs a cash machine like no other (well, certain fruit-flavored electronics companies excluded), but its profit doesn't flow from a rock-solid base like J&J's and Disney's do.
When international oil prices spike, so do Exxon's margins and cash flows. When oil prices fall back to lower levels, Exxon's entire business model follows suit. You can see this in the peaks and valleys above. Here's another look at how Exxon's cash generation generally follows oil prices.

US Crude Oil First Purchase Price data by YCharts.
There you have it: three Dow stocks and three radically different business models -- and you can see their stories in a long-term gross-margin chart.
If you're looking for some long-term investing ideas, you're invited to check out The Motley Fool's brand-new special report, "The 3 Dow Stocks Dividend Investors Need." It's absolutely free, so simply click here now and get your copy today.
No comments:
Post a Comment