BALTIMORE (Stockpickr) -- What a difference a month makes. In the last four weeks, U.S. stocks have made an about-face, suddenly shifting from a sideways churn back into rally mode. That's a welcome change for investors who've been feeling their confidence waning in equities in 2014.
>>5 Stocks Insiders Love Right Now
The better news is that we're likely to continue to see upside this year. 2013 was a momentous year for stock investors. It was one of just 11 of the years since 1975 where the S&P returned more than 20% gains. On average, during the year that followed that big gain, the big index tacked another 12.8% onto its winnings.
As I write, we're right on track for a double-digit follow-up performance in 2014. To find the big names best-positioned to take advantage, we're turning to the charts for a technical look at five setups to trade for gains this week.
If you're new to technical analysis, here's the executive summary.
Technicals are a study of the market itself. Since the market is ultimately the only mechanism that determines a stock's price, technical analysis is a valuable tool even in the roughest of trading conditions. Technical charts are used every day by proprietary trading floors, Wall Street's biggest financial firms, and individual investors to get an edge on the market. And research shows that skilled technical traders can bank gains as much as 90% of the time.
>>4 Big Stocks on Traders' Radars
Every week, I take an in-depth look at big names that are telling important technical stories. Here's this week's look at five high-volume stocks to trade this week.
Microsoft
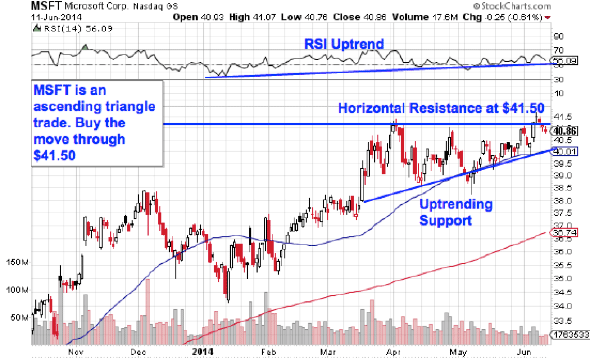
Up first is tech giant Microsoft (MSFT), a name that's been enjoying some buoyancy in 2014. Since the first session of the year, Microsoft has essentially doubled the broad market's run, climbing 9.2% higher over that stretch. And now the software behemoth is looking ready for another leg higher. Here's how to trade it.
Microsoft is currently forming an ascending triangle pattern, a bullish technical setup that's formed by a horizontal resistance level above shares (in this case at $41.50) and uptrending support to the downside. Basically, as Microsoft bounces between those two technically important price levels, it's getting squeezed closer to a breakout above that $41.50 price ceiling. When that happens, we've got a buy signal in shares.
Momentum, measured by 14-day RSI, adds some extra confidence to a breakout MSFT right now. Our momentum gauge has been making higher lows going all the way back to January. That uptrend means that up days are outpacing down days in shares of Microsoft.
Emerson Electric
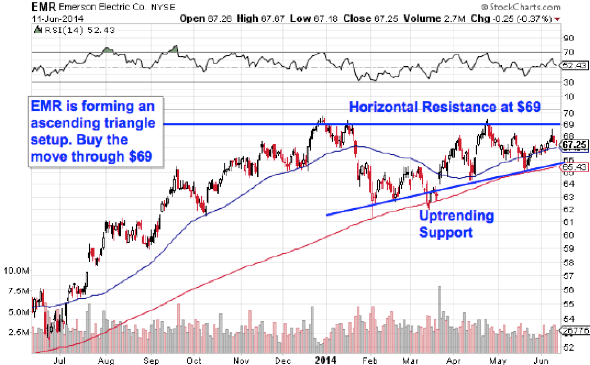
We're seeing the exact same setup in shares of Emerson Electric (EMR) right now. Like Microsoft, Emerson is currently forming an ascending triangle pattern, in this case with resistance at $69. A breakout above that $69 high water mark is the buy signal for this $47 billion tech name.
Why all of that significance at $69? It all comes down to buyers and sellers. Price patterns are a good quick way to identify what's going on in the price action, but they're not the actual reason a stock is tradable. Instead, the "why" comes down to basic supply and demand for Emerson's stock.
The $69 resistance level is a price where there has been an excess of supply of shares; in other words, it's a spot where sellers have previously been more eager to step in and take gains than buyers have been to buy. That's what makes a breakout above $69 so significant – the move means that buyers are finally strong enough to absorb all of the excess supply above that price level.
The 200-day moving average has been a solid proxy for support over the course of this setup. When the breakout happens, that's a logical place to keep a protective stop.
Macy's
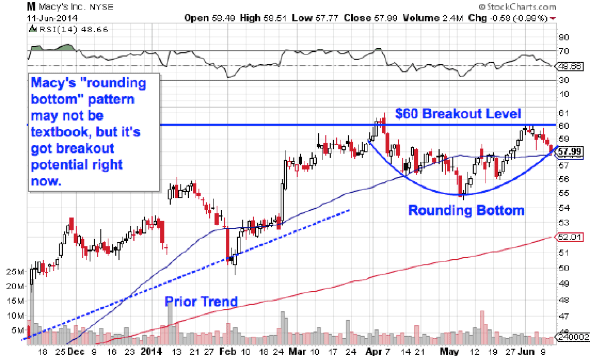
Macy's (M) has been enjoying a solid run itself for the last year and change. Since last June, shares of Macy's have climbed almost 20% higher – and like the other names on today's list, there's reason to look out for a new breakout in shares of the $21 billion department store chain this week.
Macy's is currently forming a "rounding bottom" pattern, a price setup that indicates a gradual transition in control from sellers to buyers. The pattern's name is a pretty good description of how it looks on a chart – even though Macy's rounding bottom came in at the top of its recent price range (not the bottom), the trading implications are just the same. The buy signal triggers on a move through our $60 price ceiling.
From a risk-management standpoint, the line in the sand in Macy's is down at the bottom of the setup at $55. If shares violate that floor, then the upside setup gets invalidated. Likewise, that makes $55 a perfect place to keep a protective stop – after all, if shares are able to fall below that level, you don't want to own Macy's anymore.
Genuine Parts

$13 billion auto parts maker Genuine Parts (GPC) hasn't done much lately. In the last few months, shares of GPC have essentially traded flat, churning sideways in a consolidation that didn't end when the broad market broke out in May. But that sideways churn is exactly what makes GPC tradable this week.
Genuine Parts is forming a rectangle pattern, a price setup that's formed by a pair of horizontal resistance and support levels that basically "box in" shares between $87.50 and $83. Consolidations like the one in GPC are common after big moves (like the one at the start of February); they give the stock a chance to bleed off momentum as buyers and sellers figure out their next move.
Rectangles are "if/then patterns." If GPC breaks out through resistance at $87.50, then traders have a buy signal. Otherwise, if the stock violates support at $83, then the high-probability trade is a sell. Since GPC's price action leading up to the rectangle was an uptrend, it favors breaking out above $87.50. The fact that momentum is sitting in neutral territory right now (by 50) means that this stock can potentially make a large move up without becoming overbought.
Korea Electric Power
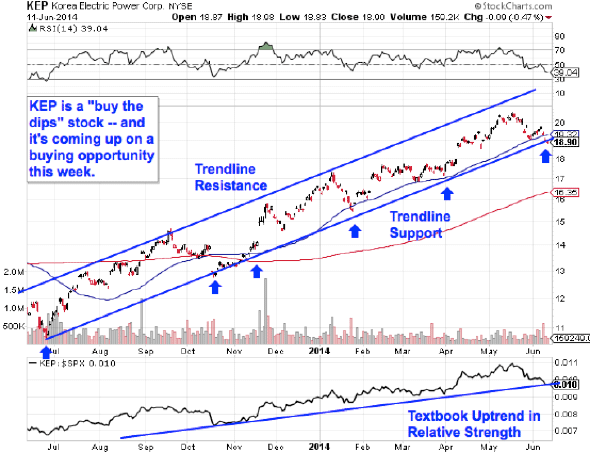
Last, but not least, is Korea Electric Power Corp. (KEP), a South Korea-based electric utility. You don't have to be an expert technical trader to figure out what makes this stock look attractive -- a quick glance at the chart should do. KEP has been bouncing its way higher in an uptrending channel since last summer, offering plenty of low-risk opportunities to be a buyer on the way up.
Now it makes sense buy the next bounce off of trend line support.
Waiting for a bounce is important for two key reasons: It's the spot where shares have the furthest to move up before they hit resistance, and it's the spot where the risk is the least (because shares have the least room to move lower before you know you're wrong). Remember, all trend lines do eventually break, but by actually waiting for the bounce to happen first, you're ensuring KEP can actually still catch a bid along that line before you put your money on shares.
Relative strength adds some important backup for a buy signal in KEP. That performance indicator has been in an uptrend for the better part of the last year, a signal that this stock is continually outperforming the S&P in good times and in bad ones.
To see this week's trades in action, check out the Must-See Charts portfolio on Stockpickr.
-- Written by Jonas Elmerraji in Baltimore.
RELATED LINKS:
>>3 Stocks Under $10 Making Big Moves
>>5 Health Care Stocks to Trade for Gains in June
>>5 Stocks Set to Soar on Bullish Earnings
Follow Stockpickr on Twitter and become a fan on Facebook.
At the time of publication, author had no positions in the names mentioned.
Jonas Elmerraji, CMT, is a senior market analyst at Agora Financial in Baltimore and a contributor to
TheStreet. Before that, he managed a portfolio of stocks for an investment advisory returned 15% in 2008. He has been featured in Forbes , Investor's Business Daily, and on CNBC.com. Jonas holds a degree in financial economics from UMBC and the Chartered Market Technician designation.Follow Jonas on Twitter @JonasElmerraji
No comments:
Post a Comment