 Craig Warga/Bloomberg/Getty Images There have been plenty of laggards in the restaurant business this earnings season, but Chipotle Mexican Grill (CMG) hasn't been one. Winter storms that slowed business to most eateries in January and the more problematic trends gnawing away at eating out in general during the balance of the quarter just didn't apply to Chipotle. The rapidly expanding chains saw comparable-restaurant sales soar 13.4 percent during the first three months of the year, bucking against the negative showings at most of the casual dining, fast food and even quick-service operators that have already reported. This is the kind of development that the market would naturally interpret as good news, but Chipotle hasn't been as lucky. In fact, the country's favorite burrito roller saw its stock hit a three-month low to kick off this new trading week, fetching levels last seen in late January. Investors are getting skittish about what they're seeing on the way down to the bottom line at Chipotle, likely unaware that today's challenge is tomorrow's opportunity. Inflation Station From coffee to milk, shrimp to limes, many food items are a lot more expensive than they were a year ago. That's inflation rearing its ugly head. Chipotle isn't adding shrimp to its menu anytime soon, and it just started testing coffee at a couple of airport locations late last year. However, it has been at the mercy of other menu components moving higher lately. The fast casual darling singled out the escalating costs of beef, avocados and cheese for nibbling away at its margins during this year's first quarter. The margin contraction was evident in Chipotle's latest quarterly report. Revenue climbed 24.4 percent as the combination of brisk expansion and hearty comps fueled another top-line pop. Net income, on the other hand, only rose 8.5 percent when pitted against last year's freshman quarter. A big reason for less of Chipotle's sales making it down to the bottom line is inflation. Food costs as a percentage of revenue has gone from 33 percent a year ago to 34.5 percent now. Spoiler alert: it's going to get worse in the near term. Chipotle's targeting food costs to eat up more than 36 percent of its revenue in the next couple of quarters, forcing analysts to scale back their earnings estimates for the current quarter. Higher Prices Aren't the End of the World The inflation is real. Cheese prices are expected to climb 10 percent this year, and it's even worse on the beef side where Chipotle's paying 25 percent more for its steak than it was when the year began. Everything from farmland droughts to a 30 percent reduction in California avocado production will result in Chipotle paying more to serve you that next foil-wrapped barbacoa burrito with cheese and guacamole. Chipotle has swallowed the increases so far, but a response is now coming after Chipotle missed Wall Street's profit forecast during the first quarter. "With all of this food inflation we have seen so far and expect to continue to see, we've decided to increase our menu prices," Chipotle announced during its mid-April earnings call. This is Chipotle's first company-wide increase in three years. It has gradually adjusted prices in some markets as competitive pressures allowed in the past, but now it has little choice but to introduce new menu boards this summer with slightly higher prices. Customers won't like it, but they're not likely to complain. The beauty of running a popular restaurant at a time of food inflation is that patrons will actually see bigger increases if they simply eat at home. After all, if items at the grocery store to assemble your meal theoretically doubled in price you would be treated to a 100 percent increase. Since food costs are a little more than a third of Chipotle's sales, passing on those costs to consumers would be closer to a 35 percent increase to keep profits intact. This is an extreme illustration, of course. Only some components have been moving higher. Chipotle believes that the increase will average somewhere in the mid-single-digits. In short, that carnitas bowl will cost you a little more, but it's not likely to break the bank. That should come as a relief to Chipotle fans heading out to lunch once the new menu boards get updated this summer, but it should also come as an even bigger relief for investors that weren't rewarded for owning the stock during an otherwise impressive quarter.
Wednesday, April 30, 2014
That Chipotle Burrito Bowl Will Soon Cost You More
Tuesday, April 29, 2014
Top 5 Electric Utility Companies For 2015
Whole Foods�Market�(NASDAQ:WFM) opened its first store in Austin, Texas, in 1980 and it has since become the undisputed king of organic grocers. The company has laid out plans to open 1,000 stores in the U.S. in the coming decades, but it remains to be seen if its business model can support this kind of growth in the long term. Let�� use our CHEAT SHEET investing framework to decide whether Whole Foods is an OUTPERFORM, WAIT AND SEE, or STAY AWAY.
C = Catalysts for the Stock�� MovementShares of Whole Foods jumped almost 10 percent on May 7 as the company announced strong second-quarter earnings. The organic grocer improved its gross margin by five basis points in the second quarter. This alleviated some concerns by investors that Whole Foods margin would erode as the competition intensified in the organic food space. Additionally, some analysts thought that Whole Foods��investments in price discounts and promotions would hurt its margins. Instead, these investments were offset by a reduction in administrative expenses due to greater economies of scale and strong comparable store sales growth of 6.9 percent.
Top 5 Electric Utility Companies For 2015: Teva Pharmaceutical Industries Limited (TEVA)
Teva Pharmaceutical Industries Limited, a pharmaceutical company, develops, produces, and markets generic drugs; and proprietary branded pharmaceuticals in various therapeutic categories and active pharmaceutical ingredients worldwide. The company?s provides generic drug portfolio of approximately 1,450 molecules and a direct presence in 60 countries. It offers generic pharmaceutical products in a range of dosage forms, such as tablets, capsules, ointments, creams, liquids, injectables, and inhalants. The company sells its generic injectable products to hospitals, clinics, and other institutional channels, primarily in the United States and Europe, as well as in Latin America and eastern Europe. Its branded products include Copaxone to treat multiple sclerosis; and Azilect to treat Parkinson?s disease, as well as biosimilars, respiratory, and women?s health products. The company was founded in 1901 and is headquartered in Petach Tikva, Israel.
Advisors' Opinion:- [By Maxx Chatsko]
Reasons for pessimism?
I may be digging a little bit here -- I admit it's tough to come up with negatives -- but Friday's announcement invalidating several Teva (NYSE: TEVA ) patents for multiple sclerosis drug Copaxone could shake up the market quite a bit. Could the emergence of two cheap generics from Momenta and Mylan in the first half of next year take some steam out of Tecfidera's rise? I can't see it being good news for either Teva or Biogen, but I'm not sure it's a death sentence, either.
Top 5 Electric Utility Companies For 2015: Scorpio Tankers Inc.(STNG)
Scorpio Tankers Inc. provides marine transportation of crude oil and refined petroleum products worldwide. As of April 26, 2011, it owned one LR2 tanker, four LR1 tankers, four Handymax tankers, and one post-Panamax tanker, as well as chartered one LR1 and four Handymax product tankers. The company was founded in 2009 and is based in Monaco, Monaco.
Advisors' Opinion:- [By Seth Jayson]
Scorpio Tankers (NYSE: STNG ) reported earnings on July 29. Here are the numbers you need to know.
The 10-second takeaway
For the quarter ended June 30 (Q2), Scorpio Tankers missed estimates on revenues and missed estimates on earnings per share. - [By Seth Jayson]
Scorpio Tankers (NYSE: STNG ) reported earnings on April 29. Here are the numbers you need to know.
The 10-second takeaway
For the quarter ended March 31 (Q1), Scorpio Tankers missed estimates on revenues and beat expectations on earnings per share.
Hot Wireless Telecom Companies To Own In Right Now: ProShares Short FTSE Xinhua China 25 (YXI)
ProShares Short FTSE China 25 (the Fund) is an exchange-traded fund. The Fund seeks daily investment results that correspond to the inverse (opposite) of the daily performance of the FTSE/Xinhua China 25 Index (the Index). The Index consists of 25 of the largest and most liquid Chinese stocks listed on the Hong Kong Stock Exchange. This free float adjusted Index caps the weight of any of constituent stock at 10% to ensure broad representation of the Chinese economy. The Fund seeks investment results for a single day only, not for longer periods. The Index is compiled and calculated by FTSE International Limited (FTSE) on behalf of FTSE/Xinhua Index Limited (FXI). The Fund will typically concentrate its investments in issuers of one or more particular industries to the same extent that its underlying Index is so concentrated. The Fund�� investment advisor is ProShare Advisors LLC. Advisors' Opinion:- [By pamatlarge]
Three short ETFs are designed to profit from China�� economic downward slide. The ProShares Short FTSE China 25 (YXI), an unleveraged ETF, holds shares in iShares FTSE China Large-Cap (FXI) swaps. Investors looking to magnify their returns can choose from two leveraged short ETFs: ProShares Ultra Short FTSE China 25 (FXP) and Direxion Daily China Bear 3x Shares (YANG). Both ProShares Ultra Short and Direxion Daily hold shares that increase in value three times faster than an unleveraged ETF. The downside is that the per share price of these leveraged ETFs also drops three times faster.
Top 5 Electric Utility Companies For 2015: Vectren Corporation (VVC)
Vectren Corporation, through its subsidiaries, provides energy delivery services to residential, commercial, and industrial and other contract customers in Indiana and west central Ohio. It offers natural gas distribution and transportation services, and electric distribution services; and owns and operates coal-fired and gas-fired electric generating facilities with an installed generating capacity of 1,298 megawatts. The company�s electric transmission system consists of 989 circuit miles of 345, 138, and 69 kilovolt lines, and 35 substations; and distribution system comprises 4,281 pole miles of lower voltage overhead lines and 372 trench miles of conduit containing 1,999 miles of underground distribution cable, 96 distribution substations, and 54,000 distribution transformers. In addition, it provides gas marketing, gas portfolio optimization, and other portfolio and energy management services to municipalities, utilities, industrial operations, schools, and healthcar e institutions; mines and sells coal; offers underground construction and repair, performance contracting, and renewable energy services; and invests in energy-related opportunities and services, real estate, and leveraged leases. Further, the company engages in transmission pipeline construction and maintenance; pump station, compressor station, terminal, and refinery construction; and hydrostatic testing services. It serves the automotive assembly, parts, and accessories; feed, flour, and grain processing; metal castings; aluminum products; polycarbonate resin and plastic products; gypsum products; electrical equipment; metal specialties; glass; steel finishing; pharmaceutical and nutritional products; gasoline and oil products; ethanol; and coal mining industries. As of December 31, 2011, it supplied natural gas services to approximately 993,300 customers; and electric services to approximately 141,600 customers. Vectren Corporation was founded in 1912 and is headquartere d in Evansville, Indiana.
Advisors' Opinion:- [By Chuck Carnevale]
Vectren Corp. (VVC): A Low Growth Utility
Our first example looks at Vectren Corp.�� historical earnings, a utility with a 15-year historical earnings growth rate that is below our 3% threshold established in Part 1. Note that fair valuation is calculated using Graham Dodd�� Formula (GDF) deriving a fair value PE of 13.8 (slightly below, but close to our PE 15 standard). However, a normal PE of 16 has been historically applied by Mr. Market. Therefore, valuation falls between a PE of 13.8 to 16, or well within a range of normalcy.
- [By Lawrence Meyers]
I like the diversification, and the fact that the company has offered many of these products for anywhere from 30 years to 100 years may explain why it�� paid a dividend for the last 32 years. That dividend is presently at 4.3%.
Vectren Corporation (VVC)The final stock on our list of secret dividend stocks is Vectren Corporation (VVC). VVC is another an energy play that�� diversified into four segments. The company provides 566,000 customers with natural gas delivery in Indiana.
Top 5 Electric Utility Companies For 2015: Vocera Communications Inc (VCRA)
Vocera Communications, Inc. (Vocera), incorporated on February 16, 2000, is a provider of mobile communication solutions. The Company�� solutions consist of its Voice Communication, Messaging and Care Transition solutions. Its Voice Communication solution, which includes a communication badge and a software platform, enables users to connect with other hospital staff. The Company�� Messaging solution delivers text messages and alerts directly to and from smartphones. Its Care Transition solution is a voice and text-based software application that captures, manages and monitors patient information when responsibility for the patient is transferred or handed-off from one caregiver to another, or when the patient is discharged from the hospital. Users can communicate with others using the Vocera communication badge or through Vocera Connect client applications available for BlackBerry, iPhone and Android smartphones, as well as Cisco wireless Internet protocol (IP) phones and other mobile devices. In January 2014, Vocera Communications Inc announced the acquisition of mVisum.
Communication solution can also be integrated with nurse call and other clinical systems to alert hospital workers to patient needs. The Company�� solutions are deployed in over 800 hospitals and healthcare facilities, including hospital systems, hospitals, and clinics, surgery centers and aged-care facilities. During the year ended December 31, 2011, the Company had shipped over 400,000 communication badges to its customers. The Company outsources the manufacturing of its products. Vocera offers a range of services, including clinical workflow design, wireless assessment, solution configuration, training and project management. It also provides a classroom-based curriculum for systems administrators, information technology professionals and clinical educators. The Company provides around-the-clock technical support to its customers through its support centers in San Jose, California, and Reading, United Kingdom.!
Voice Communication solution
The Company�� Voice Communication solution consists of a software platform that connects communication devices, including its hands-free, wearable, voice-controlled communication badges, Vocera-branded smartphones and third-party mobile devices that use its software applications to become part of the Vocera system. The system transforms the way mobile workers communicate by enabling them to connect with the right person simply by the name, function or group name of the person they want to reach, often while remaining at the point-of-care. Its system responds to over 100 voice commands.
Vocera�� Voice Communication solution is a software platform that runs on its customers��Windows-based servers. In addition, it controls the calling and messaging functions of the mobile client devices and maintains profiles for users and groups that enable customization of workflow patterns for each customer. The Company�� communication badge is a wearable device that operates over customers��wireless fidelity (Wi-Fi) networks. The badge is worn clipped to a shirt or on a lanyard. It can be used to conduct hands-free communication. It enables two-way voice conversations without the need to remember a phone number or use a handset. Its badge also incorporates automatic diagnostic mechanisms that feed data on wireless network performance back to the software platform for reporting and diagnosis of problems. In October 2011, it introduced the Vocera B3000 badge. In 2012, the Company added Cisco wireless IP phones to the list of mobile devices it supports.
Messaging solution
The Company�� Messaging solution delivers text messages, alerts and other information, directly to and from smartphones. Its solution consists of a software platform and client applications that run on BlackBerry, iPhone or Android devices. Its Messaging solution includes a range of client applications, including Alert, Chat and Commander.
Care! Transition Solution
The Company�� platform, which includes modules for patient transfers, shift changes, physician sign-outs and patient and family information exchanges, allows hospitals to standardize and monitor patient hand-offs. Its Care Transition solution can be deployed through either a hosted software-as-a-service model or as a server-on-site model and has been deployed by over 120 hospitals.
The Company competes with Cisco Systems, Ascom and Polycom.
Advisors' Opinion:- [By Evan Niu, CFA]
What: Shares of Vocera Communications (NYSE: VCRA ) have gotten slaughtered by 38% today after the company reported earnings.
So what: Revenue in the first quarter came in at $22.4 million, which translated into a non-GAAP net loss of $0.07 per share. Both figures were significantly worse than the $24.3 million in revenue and $0.02 per share adjusted loss that the Street was expecting. CEO Bob Zollars conceded that management was disappointed with the results.
BulletShares Lineup Expands Beyond 2020: Guggenheim ...
This bond ETF launch comes at an opportune time for bargain shoppers seeing as how fixed income securities across the board have endured a rough stretch of profit taking as a result of all the Fed-stimulus fears, which have already faded away for the most part.
Bond Bulls Eyeing New BulletShares ETFsThe new funds which hit the street today are the:
BulletShares 2021 Corporate Bond ETF
BulletShares 2022 Corporate Bond ETF Unlike most fixed income ETFs on the market today, the BulletShares product suite invests in debt securities scheduled to mature in a specific, single calendar year. As that year arrives and the debt begins to mature, proceeds are not reinvested but rather distributed to investors. For this reason, BulletShares ETFs have gained tremendous popularity since launching in 2010 as they more closely replicate the experience of investing in individual bonds while still providing immediate diversification across a basket of securities .
Similar to all of the existing corporate bond BulletShares ETFs, BSCL and BSCM will each charge 0.24% in expense fees.
Currently, the two most popular corporate bonds BulletShares ETFs by AUM targeting corporate bonds are the:
2015 Corporate Bond Fund 2014 Corporate Bond Fund The "junk bond" flavor of BulletShares has been even more successful, as these two High-Yield Bond ETFs dominate their investment grade-counterparts when it comes to total assets under management:
2015 High Yield Corporate Bond Fund 2014 High Yield Corporate Bond Fund Meet The Corporate Bond Fund CompetitionThe new BulletShares funds will join a fairly crowded space, ! comprised of over three dozen offerings with an average expense ratio of 0.22%. Although BulletShares separate themselves from the pack quite nicely by offering exposure that more closely resembles the purchase of an actual bond, BSCL and BSCM will still face stiff competition from more established funds; the Corporate Bonds ETFdb Category is dominated by:
iShares Investment Grade Corproate Bond Fund with $19 billions in AUM
iShares Barclays 1-3 Year Credit Bond Fund with nearly $11 billion in AUMVanguard Short-Term Corporate Bond ETF with over $6 billion in AUMThe new BulletShares products will likely taken on appeal among investors with more specific risk tolerance and current-income goals in mind given their unique, single-year maturity structure.
Follow me on Twitter @SBojinov
Disclosure: No positions at time of writing.
Sunday, April 27, 2014
10 Best & Worst Tax States for Retirees
In August, Kiplinger released an interactive map detailing the tax environment for retirees in each state. Users can compare up to five different states to get a picture of how their home states compares to others. Almost half the states were rated as tax-friendly or higher, with many of the most tax-friendly states concentrated in the South.
ThinkAdvisor looked for the five best and worst states for retirees to pay taxes in based on tax breaks offered to retirees; special considerations for retirement income; whether Social Security benefits were taxed and, of course, sales and income tax levels. We rated states that offered more benefits to retirees were better even if they had higher sales and income levels (and of course, states that offered fewer benefits came out worse).
(Check out Top 10 Offbeat, Cheap Cities for Retirement on ThinkAdvisor.)
Kiplinger published in October another interactive map that shows the tax environment in each state as it applies to residents as a whole instead of retirees.
")
5. Mississippi
Sales Tax: 7% with exemptions for prescriptions, residential utilities, motor fuel, newspapers, health care services and payments made by Medicare and Medicaid.
Income Tax: 3% for earners with less than $5,000 of taxable income; 5% for earners with more than $10,000 of taxable income.
Social Security Tax: None
Property Tax Breaks for Seniors: Disabled homeowners and those 65 and older have an exemption for the first $75,000 of property value.
Tax on Inheritances and Estates: None
Special Treatment for Other Retirement Income: Qualified retirement income is exempt from state income tax.

4. Georgia
Sales Tax: 4% with exemptions for food and prescriptions. Individual counties can add up to 4% more in sales tax.
Income Tax: 1% on the first $750 of taxable income for individuals; $500 for couples filing separately; $1,000 for couples filing jointly. The upper rate is 6% on individual earners with over $7,000; $5,000 for couples filing separately; $10,000 for couples filing jointly.
Social Security Tax: None
Property Tax Breaks for Seniors: Homeowners 62 and older are exempt from school taxes on $10,000 of their property's assessed value if they earn less than $10,000. Those with less than $30,000 may be exempt from state and local property taxes.
Tax on Inheritances and Estates: None
Special Treatment for Other Retirement Income: Disabled taxpayers or those older than 62 are eligible for an adjustment on retirement income on their state tax return.

3. Delaware
Sales Tax: None
Income Tax: 2.2% for earners with less than $5,000 in taxable income; 6.75% for earners with over $60,000. The rate for high earners will fall to 6.6% in January.
Social Security Tax: None
Property Tax Breaks for Seniors: Homeowners older than 65 are eligible for a credit of half of school property taxes up to $500 if they were residents prior to Dec. 31, 2012. Those who moved to the state after that date have to be residents for three years to be eligible for the credit.
Tax on Inheritances and Estates: No inheritance tax. The maximum estate-tax rate is 16%, with a %5.25 million exemption for 2013.
Special Treatment for Other Retirement Income: Taxpayers older than 60 can exclude $12,500 of investment and qualified pension income, even on out-of-state government pensions. The exclusion for those under 60 is $2,000.
")
2. Wyoming
Sales Tax: 4% with exemptions for food and prescriptions. Individual counties can add up to 3% more in sales tax.
Income Tax: None
Social Security Tax: None
Property Tax Breaks for Seniors: Residents 65 and older who meet income requirements are eligible for a tax rebate of up to $700 for individuals and $800 for couples.
Tax on Inheritances and Estates: None
Special Treatment for Other Retirement Income: Retirement income is not taxed.

1. Alaska
Sales Tax: There’s no state tax, but some municipalities charge a local sales tax.
Income Tax: None
Social Security Tax: None
Property Tax Breaks for Seniors: Homeowners over 65 and surviving spouses over 60 don’t have to pay municipal taxes on the first $150,000 of value on their property.
Tax on Inheritances and Estates: None
Special Treatment for Other Retirement Income: Retirement income is not taxed.

5. California
Sales Tax: A temporary tax hike set to expire in 2016 raised the rate from 7.25% to 7.5%. Some counties may have higher rates. Food and prescription drugs are exempt.
Income Tax: The lowest rate is 1% for single filers with up to $7,455; $14,910 for married joint filers. The highest rate is 13.3% for those with more than $1 million.
Social Security Tax: None
Property Tax Breaks for Seniors: None
Tax on Inheritances and Estates: None
Special Treatment for Other Retirement Income: Railroad retirement and Social Security benefits are exempt, but all other retirement income is taxable.

4. Nebraska
Sales Tax: 5.5% with exemptions for food and prescription drugs.
Income Tax: 2.46% for single earners with less than $2,400 of taxable income; $4,800 for married couples filing jointly. The upper rate is 6.84% for single filers with taxable income over $27,000 and $54,000 for married couples filing jointly.
Social Security Tax: Social Security benefits are taxed at the same rate as federal taxes.
Property Tax Breaks for Seniors: Homeowners 65 and older who meet income restrictions are eligible for exemptions if they occupy the house from January 1 through August 15. Single filers earning less than $25,801 and married filers earning less than $30,301 may be eligible for as much as $40,000 or 100% of their county's average value of single-family residential properties.
Tax on Inheritances and Estates: No estate tax, and assets inherited by a spouse or charity are not taxed. Other inheritance taxes are levied by counties and are between 1% and 18%.
Special Treatment for Other Retirement Income: None

3. Rhode Island
Sales Tax: 7% with exemptions for groceries, most clothing and footwear, precious-metal bullion under some circumstances and prescription drugs.
Income Tax: 3.75% for earners with up to $58,600 of taxable income; 5.99% for earners with taxable income over $133,250.
Social Security Tax: Social Security is taxed at the federal level. Single earners with provisional income of $25,000 or more, $32,000 for married earners filing jointly, are subject to tax on Social Security benefits.
Property Tax Breaks for Seniors: Homeowners 65 and older who earn less than $30,000 are eligible for a $300 tax credit on property taxes.
Tax on Inheritances and Estates: No inheritance tax, but the maximum estate tax rate is 16%. The exemption for 2013 is $910,725, and is adjusted for inflation every year.
Special Treatment for Other Retirement Income: Railroad retirement benefits are exempt, but most other income is taxable.
 2. Minnesota
Sales Tax: 6.87% with exemptions for food, clothing, and prescription and nonprescription drugs.
Income Tax: 5.35% for single filers with less than $24,270 of taxable income; $35,480 for joint filers. The upper rate is 9.85% for single filers with more than $150,000 of taxable income; $250,000 for joint filers.
Social Security Tax: Taxed at federal level.
Property Tax Breaks for Seniors: People 65 or older with less than $60,000 in household income can defer part of their property taxes to the state. Interest will be charged and a lien will be attached to the property.
Tax on Inheritances and Estates: No inheritance tax, but estate taxes have an exclusion of $1 million. The maximum estate tax rate is 16%.
Special Treatment for Other Retirement Income: Railroad retirement benefits are not taxed, but other retirement income is.

1. Vermont
Sales Tax: 6% with exemptions for food, clothing, prescription and nonprescription drugs. Local jurisdictions may add 1%.
Income Tax: 3.55% for individual earners with up to $36,250 of taxable income; $59,050 for married couples. The upper rate is 8.95% for single and joint filers with taxable income over $398,350.
Social Security Tax: Taxed at the federal level.
Property Tax Breaks for Seniors: None, although veterans or their surviving spouses and children can claim an exemption of the first $10,000 of appraisal value of their residence.
Tax on Inheritances and Estates: No inheritance tax, but estate tax applies to properties worth more than $2.75 million. The maximum estate tax rate is 16%.
Special Treatment for Other Retirement Income: Railroad retirement benefits are exempt; all other retirement income is taxed.
-- Check out these Top 10 lists on ThinkAdvisor:
States where the most children go hungry
Feeding America — the largest hunger relief charity and network of food banks in the U.S. — created Map the Meal Gap, a study measuring food-insecurity among the general population and children at the state and county levels. While hunger remains a problem nationally, some areas of the country had nearly double the national rate. Food-insecurity rates among children were as high as 41% in Zavala County, Texas. At the state level, New Mexico led the nation with 29.2% of children living in food-insecure households.
According to Ross Fraser, Director of Media Relations at Feeding America, children are of course more vulnerable to poverty and food-insecurity because they can't work. "You have a lot of people with large families who live in poverty, and children can't change their financial circumstances," he said.
The situation may also be considerably worse than it seems. Benefits from the Supplemental Nutrition Assistance Program (SNAP) have been sharply reduced since November 2013, after the data for the report was collected. Prior to the cut, 45% of all SNAP beneficiaries were children, according to Feeding America.
The states with the highest child food-insecurity rates are clustered in particular regions, and tend to be sparsely populated. These include states along the Mexican border, such as Texas, New Mexico, Arizona, as well as states like Mississippi. In general, they have fewer highways, less public transportation.
It is relatively easy to get on a bus and get to a food bank in a big city, explained Fraser. However, it's different "if you're living in the middle of nowhere in ! Wyoming, where there is no public transportation and you might be a hundred miles from the nearest food pantry, and you don't have a working car, and there's not a grocery store within miles and miles."
Not surprisingly, states where children have limited access to adequate meals had high poverty and unemployment rates. The 10 states with the highest child food-insecurity rates identified by Feed America had poverty rates, as well as child poverty rates, in excess of the national rate. In Mississippi the poverty rate for children was 35%, well above the national rate of 23%. Eight of the 10 states had unemployment rates exceeding the national rate of 6.6% in 2012.
According to Feeding America, prevalence of a number of chronic illnesses is higher among people living in food-insecure households. When it is difficult to find adequate meals on a regular basis, the chances of negative health outcomes go up. Fraser explained that "you have to have a healthy and nutritious diet in order to have a healthy active lifestyle — whenever that's compromised, you put that at risk." The problem can be even more severe for children. "The lack of adequate nutrition can literally change the architecture of a child's brain," Fraser pointed out.
Incidence of diabetes and obesity was especially high in the states with high rates of food-insecurity. "People who live in homes that are food-insecure have twice the rate of type 2 diabetes," said Fraser. Five states with the highest food-insecurity among children — Mississippi, Georgia, Arkansas, Texas, and North Carolina — had obesity rates above the national rate of 27.1%.
To identify the states with the highest rates of child food-insecurity, 24/7 Wall St. relied on Feeding America's report on state, county and congressional district level food-insecurity in the United States. The report measured limited access to adequate food based on a model incorporating factors such as food costs, unemployment, and poverty rates. For children, the model incl! uded elig! ibility for various school lunch programs. The model relied on 2012 data from the USDA, Bureau of Labor Statistics and U.S. Census Bureau. We also considered 2012 data from the U.S. Census Bureau, and the Bureau of Labor Statistics. Data from the Gallup-Healthways Well-Being Index is from 2012 and 2013.
These are the states where the most children go hungry.
10. North Carolina
> Child food-insecurity: 26.7%
> Child poverty rate: 26.0% (10th highest)
> 2012 Unemployment rate: 9.2% (tied-5th highest)
> Pct. with SNAP benefits: 15.3% (17th highest)
Like many of the states with high food-insecurity among children, smaller, rural communities were more likely to struggle to limited access to food. More than 20% of individuals living in Hyde County, for example, had uncertain or inadequate access to food in 2012, among the highest rates of any county in the U.S. Poor food-security also placed people at a greater risk of negative health outcomes. In a recent Gallup poll, more than 13.2% of North Carolina residents reported that they had been diagnosed with diabetes, among the nation's highest rates. North Carolina had among the worst poverty rates in 2012, with 18% of residents living below the poverty level, compared to 15.9% nationwide. The unemployment rate was also particularly bad, at 9.2% in 2012, worse than all but a handful of states.
9. Oregon
> Child food-insecurity: 27.3%
> Child poverty rate: 23.0% (20th highest)
> 2012 Unemployment rate: 8.8% (tied-11th highest)
> Pct. with SNAP benefits: 20.1% (the highest)
More than one in five Oregon residents relied on food stamps in 2012, the highest rate in the nation. Given the importance of government assistance for families in the state, the high rate of child food-insecurity, 27.3%, may not be surprising. Some have argued that historically high housing costs — Oregon's median home price was $223,900 in 2012, compared with just $171,900 nationwide — have driven up the h! omeless r! ate in the state. According to Children First for Oregon, a non-profit, nearly 4% of Oregon public school students were homeless in recent years, nearly the highest rate nationwide. Unlike many of the states with high food-insecurity, residents tended to be in good health. Obesity, diabetes and hypertension were all below the national rate.
MORE: States with the highest (and lowest) taxes
8. Texas
> Child food-insecurity: 27.4%
> Child poverty rate: 25.8% (11th highest)
> 2012 Unemployment rate: 6.8% (16th lowest)
> Pct. with SNAP benefits: 14.3% (23rd highest)
There were nearly seven million children living in Texas in 2012, more than any state except California. Of that number, more than 27%, or 1.9 million, had difficulty finding adequate meals over the course of the year. The problem was even worse in some small rural communities. More than 40% of children living in Zavala County, were considered food-insecure — by far the worst rate nationwide. While smaller communities tend to be more vulnerable, residents of larger communities often struggled with food-security as well. Of 15 counties with at least 100,000 food-insecure children, four were in Texas. More than one fifth of the under-18 population struggled to find adequate meals in each of these four counties. Limited access to crucial needs was hardly limited to food in Texas. No state had a greater percentage of its residents living without health insurance — 22.5% in 2012.
7. Florida
> Child food-insecurity: 27.6%
> Child poverty rate: 25.4% (13th highest)
> 2012 Unemployment rate: 8.8% (tied-11th highest)
> Pct. with SNAP benefits: 15.2% (18th highest)
Miami-Dade County was one of just 15 counties nationwide where more than 100,000 children suffered from food-insecurity. Florida had a relatively high unemployment rate in 2012 — 8.8%, compared with a 8.1% national rate in 2012. Household income, on the other hand, was just $45,040 in 2012, considerably lo! wer than ! the national median of $51,371. Like Texas, Florida residents had among the lowest rates of health insurance — 20.1% of residents were uninsured in 2012. Low health insurance coverage only makes matters worse when limited access to food is already producing poor health outcomes. Floridians were more likely to have been diagnosed with diabetes and to have previously suffered a heart attack than Americans in most other states.
MORE: Ten states with the lowest unemployment
6. Arkansas
> Child food-insecurity: 27.7%
> Child poverty rate: 28.5% (3rd highest)
> 2012 Unemployment rate: 7.5% (22nd lowest)
> Pct. with SNAP benefits: 15.5% (14th highest)
Like several states with poor food-security for children, Arkansas struggles with low median incomes and high poverty rates. A typical household in the state earned just over $40,000 in 2012. One in five state residents was living in poverty that year, higher than all but a handful of states. Poverty was even worse among children. Nearly 30% of residents under age 18 were living in poverty that year, third-highest nationally. Poor food-security can lead to poor health outcomes, such as obesity. More than 32% of Arkansas residents were obese last year, among the highest rates nationwide.
5. Nevada
> Child food-insecurity: 28.1% (tied-4th highest)
> Child poverty rate: 24.0% (17th highest)
> 2012 Unemployment rate: 11.5% (the highest)
> Pct. with SNAP benefits: 12.6% (19th lowest)
Food-insecurity among children is often reflected by participation in various school lunch programs. At least half of Nevada children were eligible for reduced lunch programs, actually lower than the nation rate — 80% of American children are eligible nationally. However, Nevada's state government has recognized that at least 20 rural schools did not know about these programs or were unable to participate due to lack of resources. Among the larger counties where data was available, Clark County, which! includes! the city of Las Vegas, was home to 124,600 children living in food-insecure households, among the highest figures for all U.S. counties. A poor job market may also have contributed to food-insecurity. The unemployment rate in Nevada was 11.5% in 2012, the worst rate in the country.
MORE: The fattest states in America
4. Georgia
> Child food-insecurity: 28.1% (tied-4th highest)
> Child poverty rate: 27.2% (6th highest)
> 2012 Unemployment rate: 9.0% (8th highest)
> Pct. with SNAP benefits: 16.5% (tied-9th highest)
Like many states where child food-insecurity was prevalent, Georgia struggles with high poverty rates. Nearly one in five individuals in the state lived below the poverty line in 2012, including 27% of children, both among the worst rates nationwide. Residents also relied more heavily on food stamps than in most other states, with 16.5% collecting SNAP benefits in 2012, compared with 13.6% nationwide. Health outcomes were also poor in the state, with diabetes and obesity rates both higher than the national rate. The unemployment rate was also quite high, at 9% in 2012, worse than all but a handful of states. Muscogee and Fulton counties had unemployment above 9% and food-insecurity rates of roughly 20%.
3. Arizona
> Child food-insecurity: 28.2%
> Child poverty rate: 27.0% (7th highest)
> 2012 Unemployment rate: 8.3% (14th highest)
> Pct. with SNAP benefits: 14.5% (22nd highest)
Nearly 250,000 children lived in food-insecure households in Maricopa County, which includes Phoenix, more than in all but a few counties nationwide. The food-insecurity rate in the county was 24.6%, actually lower than the statewide rate, which was more than 28% in 2012. Like most states suffering from food-insecurity, Arizona struggles with high poverty rates and a relatively high unemployment rate. The child poverty rate was 27% that year, and 8.3% of the workforce was unemployed, both among the worst nationwide.
MORE: Ten sta! tes where! inequality has soared
2. Mississippi
> Child food-insecurity: 28.7%
> Child poverty rate: 34.7% (the highest)
> 2012 Unemployment rate: 9.2% (tied-5th highest)
> Pct. with SNAP benefits: 19.4% (2nd highest)
Mississippi was home to the county with the highest food-insecurity rate in the nation, Humphreys County, where 33% of all residents were unable to reliably find three adequate meals a day. Mississippi continued to lead the nation with a poverty rate of more than 24.2% in 2012. The poverty rate for children was even higher, at 35% — the highest rate nationwide. Low incomes in the state help explain the high poverty rates. A typical Mississippi household made less than $37,095 in 2012, a lower median income than any other state. Mississippi had the highest obesity rate of any state in 2012, and residents were more likely to be diagnosed with diabetes and have previously had a heart attack than the vast majority of Americans.
1. New Mexico
> Child food-insecurity: 29.2%
> Child poverty rate: 29.3% (2nd highest)
> 2012 Unemployment rate: 7.1% (22nd lowest)
> Pct. with SNAP benefits: 16.5% (tied-9th highest)
Nearly 30% of children were living in food-insecure households in New Mexico, the highest rate in the country. While unemployment was actually lower than the national rate, at 7.1% in 2012, the state has struggled with a low median income and high poverty rates. More than 20% of all individuals, and nearly 30% of children, lived below the poverty line in 2012, both second-worst in the nation. New Mexico's poverty problem is among the nation's oldest and most severe. According to the USDA, the state is designated as an area of "persistent poverty" with the problem extending back to at least the 1970 Census.
24/7 Wall St. is a USA TODAY content partner offering financial news and commentary. Its content is produced independently of USA TODAY.
Saturday, April 26, 2014
Facebook's Earnings Results Deliver the Likes
Judging by Facebook's (NASDAQ: FB ) stellar performance post earnings announcement, its second-quarter results didn't disappoint last night. The company reported revenues of $1.81 billion, an increase of 53% year over year, translating to a non-GAAP net income increase of 65%, to $488 million, or $0.19 a share. The analyst consensus was hoping Facebook would earn $1.62 billion in revenue and bring home $0.12 a share in earnings.
For the month of June, the average number of daily active users increased by 27% year over year, to 699 million. The social network closed its quarter with 1.15 billion monthly active users, an increase of 21% year over year. Additionally, mobile monthly active users now represent 71% of all Facebook users and, as a percentage of advertising revenue, it accounted for 41%, a strong improvement from the first quarter when mobile only made up 30% of advertising revenue. In other words, Facebook is monetizing mobile in a more effective manner.
Healthy vitals
One of the more effective ways to measure the health of Facebook's business is to look at how its average revenue per user, or ARPU, is faring against monthly active user growth. By comparing these two metrics, you can get a better sense of what's driving Facebook's results -- user growth or improved monetization. Ultimately, when user growth begins to slow, user monetization will become the key driver of the business. Based on 1.15 billion monthly active users, every penny of ARPU generates $11.5 million in revenue to Facebook's top line.
On a year-over-year basis, user growth increased by 21%, but worldwide ARPU increased by 25%, to $1.60, indicating that Facebook is extracting value out of its existing users faster than it is growing its user base. This is a good sign of things to come, and shows that Facebook is figuring out how to more effectively monetize the world's largest social network.
Slow clap
Thanks to outsized growth in ARPU compared to user growth, investors should be pleased that Facebook's investments in earning the trust of marketers are beginning to pay off. Additionally, it appears that Facebook has begun to find its stride, easing fears that the company isn't just a social network, but also a viable business longer term. Throw in the many ways Facebook can improve its existing business, and it's likely that the company's earnings potential is still within the early stages.
Perhaps now is the time to buy?
So much of our technological lives are shaped and molded by just a handful of companies. Find out "Who Will Win the War Between the 5 Biggest Tech Stocks?" in The Motley Fool's latest free report, which details the knock-down, drag-out battle being waged by the five kings of tech. Click here to keep reading.
Sarepta Therapeutics Inc. (SRPT): $54 Approved By JMP Securities
It's not every day that a stock is up 40% but still might have another 50%+ to go. However, that is the case with Sarepta Therapeutics Inc. (NASDAQ:SRPT).
Sarepta Therapeutics Inc., formerly AVI BioPharma, Inc., biopharmaceutical company focused on the discovery and development of ribonucleic acid (RNA)-based therapeutics for the treatment of rare and infectious diseases. Its product candidates include Eteplirsen, AVI-6002, AVI-6003, and AVI-7100.
From what we can gather online:
AVI-6002 is for the Ebola virus AVI-6003 is for Marburg hemorrhagic fever (MHF) AVI-7100 is for H1N1 (swine flu).
[Related -Stock End 1 Pct Higher On Earnings, Gold; Coca-Cola (KO) Jumps]
Al the hubaloo today is due to Eteplirsen. Earlier today, the company announced it plans to submit a New Drug Application (NDA) to the U.S. Food and Drug Administration (FDA) by the end of 2014 for the approval of eteplirsen for the treatment of Duchenne muscular dystrophy (DMD). Eteplirsen is Sarepta's lead exon-skipping drug candidate in development for the treatment of patients with DMD who have a genotype amenable to skipping of exon 51.
Chris Garabedian, president and chief executive officer says, "As we announce our plan to submit an eteplirsen NDA by the end of 2014, we are very pleased with the detailed guidance that the FDA has provided us on a potential eteplirsen approval pathway and their support of a historically controlled eteplirsen confirmatory study. We also appreciate that the FDA shares our urgency in dosing a broader base of eteplirsen patients and has encouraged us to begin the clinical program with our follow-on exon-skipping drugs as soon as possible."
[Related -Stock Upgrades And Downgrades: CHRW, DWA, ODFL, PXD, S, SRPT, TMO]
As such, management plans to initiate several additional clinical studies with eteplirsen later this year in exon-51 amenable genotypes.
A pair of research firms upped their opinions on SRPT on the FDA news. William Blair and JMP Securities moved to an "outperform" rating from "market perform." JPM put a price tag of $54 – upside potential of 58.82% to target.
According to the CDC, "Duchenne muscular dystrophy (DMD) is a genetic disorder that causes muscles to gradually weaken over time. A person with DMD will eventually lose the ability to walk and will have problems with breathing and his or her heart. It most often affects boys and occurs among all races and cultures. Sometimes this disorder affects other members of a person's family, but in many cases it is new to a family."
The Muscular Dystrophy Associations (MDA) says, "DMD is the most frequently occurring and one of the most rapidly progressive of the childhood neuromuscular disorders. It affects approximately 1 in 3500 live male births throughout the world. DMD affects only boys (with extremely rare exceptions)."
The CDC reports roughly 4 million babies are born in the US per year. Slightly more than half are boys, meaning a little more than 2 million "It's a Boys" annually. Using the MDA's 1 in 3,500 figure, we arrive at about 570 babies born a year with the condition.
At the moment, SRPT has a market cap of $1.28 billion on trailing twelve month (TTM) revenue of $14.22 million – 64.82 times sales is a steep price to pay.
The average biotech trades at 16 times sales. Now, if Sarepta Therapeutics captured 100% of the potential market for the next decade, they would have to charge $14,000 per year to generate enough revenue to meet the current market cap using the average price-to-sales ratio. That doesn't include any revenue sources beyond eteplirsen. At JPM's $54, the cost would have to be $22,314 per year to trade at the peer average P/S ratio.
Overall: In our opinion, Sarepta Therapeutics Inc. (NASDAQ:SRPT) is more likely to get to $54 compliments of a short squeeze as 40% of the float (stock available for trading) is sold, than from eteplirsen driven fundamentals.
Buffalo Wild Wings Leading on Tech Innovation
Buffalo Wild Wings Inc. (BWLD) owns, operates and franchises a chain of more than 900 casual dining restaurants across the United States and Canada. Buffalo Wild Wings has a strong brand prospect and is considered one of the most popular casual dining restaurant chains – with a dine and watch concept and 40 television sets per outlet. The company offers its chicken wings, hamburgers, sandwiches, salads and beers until 2am. Not only sports fan love Buffalo but also families which enjoy taking their children to restaurants where their children can watch TV and play videogames.
Its franchising system allows the company to safeward earnings. With more than 50% of its business franchised, the company reduces capital requirements and facilitates EPS growth and ROE expansion. Moreover, it also allows increasing free cash flow, which permits Buffalo to reinvest in brand recognition, and shareholder return.
Despite the unstable economic scenario, the company has managed to keep posting positive results, being well position within the market as to sustain its same-stores sales growth. Fourth quarter 2013 earnings of $1.10 were above estimations, increasing 23.6% versus 2012, driven by an increase in the top line and lower costs of sales. The new menu launches and marketing strategies are likely to continue boosting the company's sales, and the recent association with NCAA will further increases visibility.
Innovations
Buffalo Wild Wings has been investing in new product development. New menu items such as rib slammers, flat breads and Sam Adams Rebel IPA, the company's new beer, Buffalo, has been able to enhance its menu and attract more customers. It has also successfully changed its traditional way of menu serving chicken wings, with new weight based portions. These efforts have resulted on improved margins and more stable earnings.
Another initiative introduced in the guest experience business model is the installment of tablets in all of its restaurants to provide exclusive social gaming opportunities. Teaming up with NTN Buzztime Inc. (NTN) Buffalo uses Beond tablets to allow guests order food and drinks, play games, and pay their bill. Also, the three-year collaboration with National Collegiate Athletic Association (NCAA) has enabled the company to be an authorized hangout for the NCAA March Madness sports series, increasing visibility as a brand and attracting more customers to their outlets. These efforts, along with more intense advertising initiatives, new point-of-sales programs, improved supply chain and remodeling of its restaurants are expected to boost sales, and strengthen the business in the long run. Buffalo Wild Wings has selected the NCR Corp. (NCR) Aloha Online Ordering solution for its locations to help drive its takeout ordering business. The NCR technology will enable Buffalo to handle both on and off-premise transactions within one system.
Expansion
The company has also been focusing on store opening. Despite the macroeconomic uncertainty, Buffalo has kept with this initiative, and has witnessed unit growth of nearly 11.6% in 2011, 9.1% in 2012 and 10.9% in 2013. Moreover, associations are on track, and the company has acquired a minority stake in PizzaRev, launching in 2012 PizzaRev fast-casual pizza restaurant, with a Craft Your Own initiative. The company plans to open two more PizzaRev units in Minneapolis in 2014 and a few more outlets by the end of 2014. Another partnership on track is with Pepsico Inc. (PEP) and Dr. Pepper Snapple Group, Inc. (DPS) to serve drinks across all its locations. Through these partnerships, Buffalo Wild Wings is developing new sauces and salad dressings for the restaurant chain, like the Mountain Dew-flavored salad dressing and Doritos-flavored wing sauce. These partnerships are expected to increase visibility and improve guest traffic as well.
Economic setbacks
Macroeconomic uncertainties are always threatening restaurant industry companies, as the budget cuts, the high tax rates and tightened credit availability hurt consumer discretionary spending. In addition, the strong competition amid this industry intensifies margin pressures. Still, Buffalo Wild Wings margins are improving given their new initiatives. But the increased expenses and investments to fuel long-term growth might hurt profits in the near term.
The company's revenue missed analysts' estimates last quarter, but its traffic remained very strong. Top line increased year over year, and total revenue increased 12.4%, despite missing estimations of $345.0. Still, the growth of Buffalo Wild Wings has been outstanding: from 553 locations to more than 1,000 restaurants today, for a 12% compounded annual growth rate in locations.
Bottom line
The company has recently been developing numerous initiatives to attract more customers and enhance its brand furthermore. Improving its facilities, introducing technology and with different marketing campaigns, Buffalo is likely to keep in a highly competitive position and boost its sales. Buffalo Wild Wings' comparable-store sales increased 5% and its profit grew an astonishing 25%.
Disclosure: Damian Illia holds no position in any of the stocks mentioned
About the author:Damian IlliaA fundamental analyst at Lonetreeanalytics.com constantly looking for value and income investments.Visit Damian Illia's Website
| Currently 5.00/512345 Rating: 5.0/5 (1 vote) | Voters: |
More GuruFocus Links
| Latest Guru Picks | Value Strategies |
| Warren Buffett Portfolio | Ben Graham Net-Net |
| Real Time Picks | Buffett-Munger Screener |
| Aggregated Portfolio | Undervalued Predictable |
| ETFs, Options | Low P/S Companies |
| Insider Trends | 10-Year Financials |
| 52-Week Lows | Interactive Charts |
| Model Portfolios | DCF Calculator |
RSS Feed  | Monthly Newsletters |
| The All-In-One Screener | Portfolio Tracking Tool |
 MORE GURUFOCUS LINKS
 | Latest Guru Picks | Value Strategies |
| Warren Buffett Portfolio | Ben Graham Net-Net |
| Real Time Picks | Buffett-Munger Screener |
| Aggregated Portfolio | Undervalued Predictable |
| ETFs, Options | Low P/S Companies |
| Insider Trends | 10-Year Financials |
| 52-Week Lows | Interactive Charts |
| Model Portfolios | DCF Calculator |
| RSS Feed | Monthly Newsletters |
| The All-In-One Screener | Portfolio Tracking Tool |
 136.52 (1y: +45%) $(function(){var seriesOptions=[],yAxisOptions=[],name='BWLD',display='';Highcharts.setOptions({global:{useUTC:true}});var d=new Date();$current_day=d.getDay();if($current_day==5||$current_day==0||$current_day==6){day=4;}else{day=7;} seriesOptions[0]={id:name,animation:false,color:'#4572A7',lineWidth:1,name:name.toUpperCase()+' stock price',threshold:null,data:[[1367211600000,94.33],[1367298000000,89.993],[1367384400000,88.99],[1367470800000,90.28],[1367557200000,91.88],[1367816400000,92.49],[1367902800000,93.1],[1367989200000,92.98],[1368075600000,92.92],[1368162000000,94.61],[1368421200000,92.25],[1368507600000,94.18],[1368594000000,93.89],[1368680400000,94.82],[1368766800000,95.02],[1369026000000,96.14],[1369112400000,96.88],[1369198800000,95.33],[1369285200000,95.22],[1369371600000,94.53],[1369717200000,95.9],[1369803600000,95.19],[1369890000000,95.74],[1369976400000,95.96],[1370235600000,96.04],[1370322000000,95.85],[1370408400000,93.67],[1370494800000,95.36],[1370581200000,97.06],[1370840400000,98.01],[1370926800000,98.2],[1371013200000,97.02],[1371099600000,98.15],[1371186000000,97.35],[1371445200000,97.17],[1371531600000,99.3],[1371618000000,99.17],[1371704400000,97.46],[1371790800000,95.35],[1372050000000,94.44],[1372136400000,96.97],[1372222800000,99.37],[1372309200000,98.31],[1372395600000,98.24],[1372654800000,99.47],[1372741200000,99.58],[1372827600000,99.39],[1373000400000,101.24],[1373259600000,102.77],[1373346000000,103.65],[1373432400000,103.61],[1373518800000,104.34],[1373605200000,104.96],[1373864400000,105.05],[1373950800000,100.5],[1374037200000,100.26],[1374123600000,99.83],[1374210000000,100.06],[1374469200000,99.84],[1374555600000,98.12],[1374642000000,95.44],[1374728400000,95.92],[1374814800000,97.93],[1375074000000,98.39],[1375160400000,97.69],[1375246800000,103.58],[1375333200000,106.84],[1375419600000,107.14],[1375678800000,108.25],[1375765200000,106.9],[1375851600000,106.48],[1375938000000,106.92],[1376024400000,106.74],[1376283600000,106.25],[1376370000000,105.18],[1376456400000,105.08],[1376542800000,105.07],[1376629200000,104.92],[1376888400000,105.11],[1376974800000,107.19],[1377061200000,106.62],[1377147600000,109.55],[1377234000000,108.41],[1377493200000,107.98],[1377579600000,105.03],[1377666000000! ,105.12],[1377752400000,105.61],[1377838800000,103.91],[1378184400000,104.9],[1378270800000,105.76],[1378357200000,105.6],[1378443600000,104.68],[1378702800000,105.57],[1378789200000,107.27],[1378875600000,107.25],[1378962000000,107.4],[1379048400000,109.82],[1379307600000,110.62],[1379394000000,111.34],[1379480400000,110.87],[1379566800000,109.88],[1379653200000,109.55],[1379912400000,108.65],[1379998800000,108.35],[1380085200000,108.35],[1380171600000,109.83],[1380258000000,109.5],[1380517200000,111.175],[1380603600000,116.248],[1380690000000,120.36],[1380776400000,115.43],[1380862800000,116.04],[1381122000000,113.93],[1381208400000,113.1],[1381294800000,113.26],[1381381200000,117.12],[1381467600000,119.42],[1381726800000,119.21],[1381813200000,120.34],[1381899600000,119.6],[1381986000000,118.49],[1382072400000,119.43],[1382331600000,118.53],[1382418000000,123.06],[1382504400000,121.43],[1382590800000,121.11],[1382677200000,125.07],[1382936400000,126.36],[1383022800000,129.51],[1383109200000,141.22],[1383195600000,142.58],[1383282000000,142.745],[1383544800000,144.96],[1383631200000,150.38],[1383717600000,145.72],[1383804000000,143.07],[1383890400000,145.11],[1384149600000,144.51],[1384236000000,144.82],[1384322400000,145.31],[1384408800000,145.35],[1384495200000,149.92],[1384754400000,149.56],[1384840800000,149.24],[1384927200000,145.28],[1385013600000,151.82],[1385100000000,150.77],[1385359200000,149.93],[1385445600000,148.94],[1385532000000,150.8],[1385704800000,150.24],[1385964000000,149.58],[1386050400000,149.54],[1386136800000,146.75],[1386223200000,148],[1386309600000,149.28],[1386568800000,148.55],[1386655200000,146.43],[1386741600000,143.86],[1386828000000,141.77],[1386914400000,142.49],[1387173600000,143.58],[1387260000000,142.46],[1387346400000,147.14],[1387432800000,142.83],[1387519200000,143.96],[1387778400000,145.99],[1387864800000,145.46],[1388037600000,145.68],[1388124000000,146.08],[1388383200000,147.31],[1388469600000,147.2],[1388642400000,144.46],[1388728800000,143.57],[138898800000! 0,147.19]! ,[1389074400000,147.24],[1389160800000,151.49],[1389247200000,146.43],[1389333600000,144.55],[1389592800000,142.03],[1389679200000,144.73],[1389765600000,145.62],[1389852000000,143.32],[1389938400000,141.47],[1390284000000,136.88],[1390370400000,136.53],[1390456800000,134.85],[1390543200000,135.47],[1390802400000,133.8],[1390888800000,133.3],[1390975200000,133.04],[1391061600000,133.39],[1391148000000,141.86],[1391407200000,136.04],[1391493600000,140.75],[1391580000000,127.12],[1391666400000,131.88],[1391752800000,134.43],[1392012000000,132.55],[1392098400000,133.44],[1392184800000,131.96],[1392271200000,133.17],[1392357600000,132.4],[1392703200000,133.87],[1392789600000,132.31],[1392876000000,133.05],[1392962400000,132.27],[1393221600000,136.92],[1393308000000,136.85],[1393394400000,138.27],[1393826400000,144.97],[1393912800000,148.48],[1393999200000,147.05],[1394085600000,149.07],[1394172000000,151.91],[1394427600000,148.8],[1394514000000,148.33],[1394600400000,149.37],[1394686800000,147.31],[1394773200000,148.22],[1395032400000,151.64],[1395118800000,153.19],[1395205200000,151.18],[1395291600000,153.16],[1395378000000,156.35],[1395637200000,151.96],[1395723600000,147.51],[1395810000000,143.86],[1395896400000,141.55],[1395982800000,147.52],[1396328400000,152.04],[1396414800000,145.99],[1396501200000,146.83],[1396587600000,142.99],[1396846800000,140.07],[1396933200
Friday, April 25, 2014
3 Hot Stocks on Traders' Radars
BALTIMORE (Stockpickr) -- Put down the 10-K filings and the stock screeners. It's time to take a break from the traditional methods of generating investment ideas. Instead, let the crowd do it for you.
>>5 Mega-Cap Stocks to Trade for Gains
From hedge funds to individual investors, scores of market participants are turning to social media to figure out which stocks are worth watching. It's a concept that's known as "crowdsourcing," and it uses the masses to identify emerging trends in the market.
Crowdsourcing has long been a popular tool for the advertising industry, but it also makes a lot of sense as an investment tool. After all, the market is completely driven by the supply and demand, so it can be valuable to see what names are trending among the crowd.
While some fund managers are already trying to leverage social media resources like Twitter to find algorithmic trading opportunities, for most investors, crowdsourcing works best as a starting point for investors who want a starting point in their analysis. Today, we'll leverage the power of the crowd to take a look at some of the most active stocks on the market today.
>>5 Stocks Under $10 Set to Soar
These "most active" names are the most heavily-traded names on the market -- and often, uber-active names have some sort of a technical or fundamental catalyst driving investors' attention on shares. And when there's a big catalyst, there's often a trading opportunity.
Without further ado, here's a look at today's stocks.
General Motors
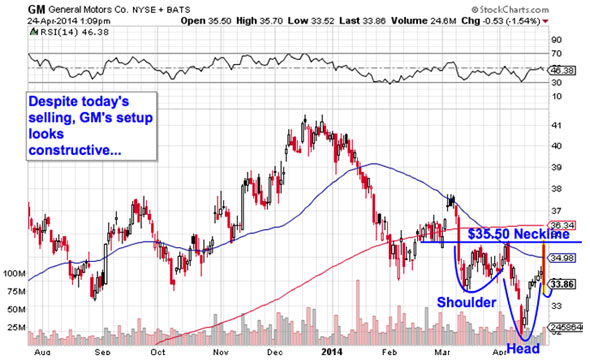
Nearest Resistance: $35.50
Nearest Support: $32
Catalyst: Q1 Earnings
Despite some big black clouds over its first-quarter earnings call, General Motors (GM) beat analysts' expectations by 2 cents, taking home 6 cents per share in profit. Recalls hammered earnings, with a $1.3 billion one-time charge for recall repairs on the books. But while things were "less bad" than expected, investors are pushing shares lower on big volume this afternoon.
Looking longer-term, GM's chart could actually look a lot worse. This stock is looking "bottomy" after spending all of 2014 selling off to the tune of 14%. A breakout above $35.50 is the signal that it's time to be a buyer in GM.
ServiceNow
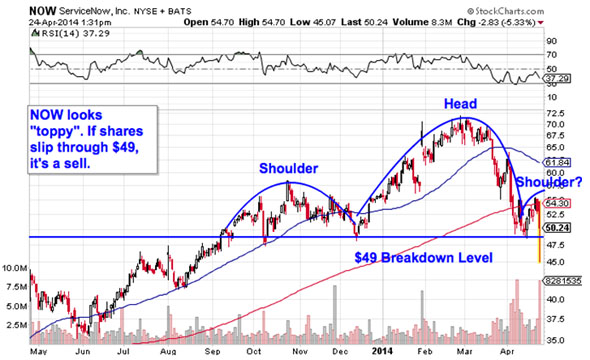
Nearest Resistance: $55
Nearest Support: $49
Catalyst: Q1 Earnings
$7 billion cloud-based IT service firm ServiceNow (NOW) is down 6% on big volume this afternoon, following a wider-than-expected loss for the first quarter. NOW lost 30 cents per share in the first three months of 2014, while investors were only expecting a consensus loss of 8 cents. The fundamental miss isn't a game-changer for this stock, but the technical miss paints a different picture.
NOW looks "toppy" in the longer-term. Shares have been forming a head and shoulders top since the start of October, a bearish setup that triggers on a move through support at $49. The setup in NOW is a long-term pattern, and that means that it comes with equally long-term trading implications on a breakdown below that $49 level. Shares flirted with a breakdown this morning before recovering later in the day. Keep a close eye on NOW's ability to catch a bid this week.
Verizon
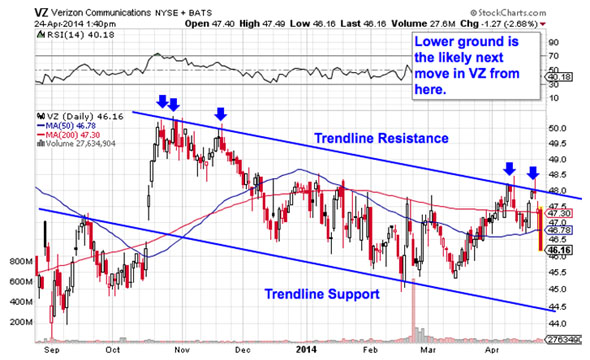
Nearest Resistance: $48
Nearest Support: $44.50
Catalyst: Q1 Earnings, Technical Setup
Verizon Communications (VZ) is seeing some earnings-induced selling of its own this afternoon. Verizon posted its first-quarter numbers this morning, earning 84 cents for the last three months. That number fell 3 cents short of the 87 cent profit that analysts were expecting, but the real story is in subscriber count -- VZ lost wireless customers for the first time in its history last quarter, a byproduct of a hugely competitive market that's quickly becoming commoditized.
From a technical standpoint, the 2.7% drop on high volume today shouldn't come as a big surprise. After all, VZ has been bouncing lower in a well-defined trend channel since last November. With shares touching the top of the range back on Monday, a move lower was the high-probability outcome unless VZ really impressed investors. Look for shares to settle closer to $44.50 from here.
To see these stocks in action, check out the at Most-Active Stocks portfolio on Stockpickr.
-- Written by Jonas Elmerraji in Baltimore.
RELATED LINKS:
>>QE5 Is Coming -- Here's What It Means to Your Portfolio
>>5 Stocks With Big Insider Buying
>>3 Big-Volume Stocks to Trade for Breakouts
Follow Stockpickr on Twitter and become a fan on Facebook.
At the time of publication, author was long AAPL.
Jonas Elmerraji, CMT, is a senior market analyst at Agora Financial in Baltimore and a contributor to
TheStreet. Before that, he managed a portfolio of stocks for an investment advisory returned 15% in 2008. He has been featured in Forbes , Investor's Business Daily, and on CNBC.com. Jonas holds a degree in financial economics from UMBC and the Chartered Market Technician designation.Follow Jonas on Twitter @JonasElmerraji
Thursday, April 24, 2014
Pump Prices Are Rising Quickly: Counterattack Now
Since the early 1970s, most major oil deals have been transacted in "petrodollars."
But that system has become increasingly challenged in recent years.
The conflict in Ukraine right now has only served to exacerbate things.
As America leads the charge to impose Western sanctions on Russia, it's a plan that's not only backfiring, but leading to opportunities for those who understand the consequences...
The Waning PetrodollarAfter Nixon infamously closed the gold window in 1971, something needed to be done to retain the U.S. dollar's status as world reserve currency.
So Kissinger and Nixon hatched the petrodollar system, whereby the United States would provide political and security support to Saudi Arabia's royal family.
In exchange, all oil deals would have to be transacted exclusively in dollars, so the House of Saud would buy lots of Treasuries with their greenbacks and influence other OPEC members to follow suit.
In effect, this guaranteed a constant and elevated (though artificial) demand for U.S. dollars worldwide.
But this fabricated demand is waning as trading nations question the need for a petrodollar, and even the U.S. dollar as a reserve currency.
The Impact of Playing Russian RouletteSince Russia's recent seizure of Crimea, the West has imposed a number of sanctions on Russians from Putin's inner circle, such as asset freezes and travel bans.
In late March, both Visa and MasterCard temporarily suspended service with seven Russian banks without warning, since their controlling shareholders were being sanctioned.
That prompted Putin to say Russia should create its own national card payment system, much like China and Japan did years ago.
Then roughly a week later, JPMorgan blocked a payment from a Russian embassy in Kazakhstan to an affiliate of a U.S.-sanctioned bank, Sogaz Insurance Group. It was for a measly $5,000, but that was enough to make sparks fly.
An infuriated Russian foreign ministry called the decision "illegal and absurd." The next day, JPMorgan agreed to process the payment.
Inevitably, these tactics have left Russia with a bad taste, and increasingly exploring its options.
Russia's Reading China's PlaybookFeeling uncomfortably vulnerable from these and other aggressive financial sanctions, Russia has begun looking to its Southern neighbor, China, for alternative trade routes.
Already Rosneft, Russia's largest oil company, has recently inked a number of large oil contracts for export to China, and apparently a "mega-deal" is nearing completion with Indian firms.
What's notable here is that, in both cases, not a single U.S. dollar will change hands.
But Russia's circumventing the petrodollar won't end there.
Since January Iran has been discussing the possibility of a barter deal, with Rosneft taking up to 500,000 barrels/day of Iranian oil to sell into world markets. In return, Russia would provide Iran with a number of Russian goods that it needs.
This kind of trade deal is being explored due to sanctions against Iran over its nuclear program. It could be worth an extra $1.5 billion per month for Tehran, once again outside the petrodollar.
Back in January, I told you how China was sidestepping the U.S. dollar. In The Golden Yuan Is Coming - Here's How to Play It, I spoke of how China has been establishing currency swaps with other countries to settle trade. They now have as many as 25 such swap agreements in place with various nations, estimated to be worth nearly $1 trillion.
Meanwhile Igor Sechin, CEO of Rosneft, has been named chairman of the Saint Petersburg Commodity Exchange, which is focused on commodity trading. Sechin told the World Energy Congress in October, referring to the natural gas markets, that "it was advisable to create an international exchange for the participating countries, where transactions could be registered with the use of regional currencies." Very similar indeed to China's approach.
So where does all of this leave us?
What bearing will the migration away from the dollar in terms of a reserve currency and petrodollar usage impact you as a citizen and investor? How It Should Play Out... And How to Beat ItThe tectonic shift away from the petrodollar portends a weaker greenback in the future.
And since oil - arguably the most important actively traded commodity on the planet - is priced in U.S. dollars (for now), it's easy to see world oil prices continue their steady climb higher.
The downside is that it will likely cost you more at the gas pump. The United States is producing a lot more oil, but the prospects of exporting it will support high prices. Still, this doesn't have to be a losing proposition.
Subscribers to Real Asset Returns have already benefitted from holding two mega-cap integrated oil companies. One has returned nearly 19% in two years, and the other nearly 70% over four years.
One way to fight back is by betting on higher oil prices. Consider the Energy Select Sector SPDR ETF (NSYE: XLE), which holds some of the biggest players in this sector, including major oil producers, shale producers, and exploration services companies.
It's up 14% in the past year, but still trades at a reasonable P/E of 14 while yielding a 1.79% dividend.
The key takeaway here is that the petrodollar is on its way down, and eventually out.
That pressure is going to lead to higher prices for oil in U.S. dollars.
And higher prices at the pump, which is all the more reason to hit back hard with a bolstered portfolio...
Wednesday, April 23, 2014
Amazon adding HBO shows to Instant Video
The company announced a multi-year deal with HBO to host several former television series, including The Sopranos, The Wire and Deadwood. Earlier seasons of current shows such as Girls, Veep and The Newsroom will also be available, although HBO's biggest hit, Game of Thrones, is absent.
The first HBO programs will appear on Instant Video on May 21.
"HBO original content is some of the most-popular across Amazon Instant Video — our customers love watching these shows," says Brad Beale, Amazon's director of content acquisition, in a statement.
Amazon also announced its newly-revealed Fire TV set-top box will add the HBO Go app later this year.
Amazon has a similar content arrangement with Showtime, featuring older series such as The Tudors and The L Word.
The Instant Video library is available to customers with a subscription to Amazon Prime. The company recently raised prices on the service from $79 a year to $99.
Follow Brett Molina on Twitter: @bam923.
The World's Best Smartphone Camera -- From Sony?
A new Android phone coming from Sony (NYSE: SNE ) is rumored to have a camera capable of capturing 4K Ultra HD video. If you think your HD television picture looks sharp, then hold on to your eyeballs. Ultra HD has four times the resolution of HD.
That's 3840 x 2160 pixels, compared with 1920 x 1080 pixels. Go ahead; do the math.
But if you don't have an Ultra HD TV -- and it's much more likely you would have a 3D-TV than a 4K TV, given much higher set prices and limited 4K content -- would a smartphone with a 4K video camera be incentive enough to make the switch to a Sony phone from a Samsung, Apple (NASDAQ: AAPL ) , or HTC handset?
Or is that putting the cart before the horse? Selling more smartphones might not be Sony's real agenda. Since Sony also makes Ultra HD TVs, one might think the rationale behind a super camera enabled smartphone could be to boost its 4K television sales.
If so, wouldn't Samsung be getting ready with its own 4K-camera phone to promote its line of Ultra HD TVs?
With the current high prices for these state-of-the-art Ultra HD televisions, Sony and Samsung would need all the promotional help they could get. The cheapest is Sony's 55-inch model, which goes for $5,000. And one could buy a Toyota Prius for the price of its 84" model: $25,000.
But don't get off the floor just yet: Samsung's 85-inch Ultra HD set retails for $40,000. No kidding.
There's one more very important reason for Sony -- and Samsung, too -- to try to get ahead of the Ultra HD curve with a 4K smartphone camera. The UHD standards are not yet set in stone, and the company that can garner the most UHD sales could influence the future definitive 4K standard.
That means getting as many consumers as possible hooked on a company's 4K standard as early as possible. When it comes to setting technical standards, it's often the most popular standard that wins out, not necessarily the one that is technically superior.
Remember, Betamax vs, VHS? Sony's Betamax format supposedly yielded a better picture, yet because of lower prices on VHS records and the ability to record longer programs, the VHS standard was triumphant.
With the success of such 3-D movies as Avatar, the TV makers could be excused for thinking 3-D TV would be the next big thing. That hasn't happened, and Samsung has admitted that 3-D TV sales in 2012 were a big disappointment.
Along with the higher cost for 3-D TVs came poorer picture quality and the necessity for special viewing glasses. The format may not just disappear, but it will remain only a novelty.
What has proved to be a winner for TV makers -- though not for cable TV providers -- are so-called "smart" TVs, those that can be connected to the Internet to stream video. And streaming will likely become the most viable delivery system for UHD programming.
Neil Hunt, Netflix's (NASDAQ: NFLX ) chief product officer, told The Verge in an interview last March that Netflix will start streaming 4K content "within a year or two."
I think Hunt is very serious about this. Netflix shot its very first original production, House of Cards, in 4K, at a cost of over $100 million. The Netflix revival of Arrested Development was also shot in 4K.
Meanwhile, returning to Sony's 4K future: At the beginning of the year, it said it would have a U.S. launch of the first consumer oriented 4K video distribution service sometime in the summer.
But Sony and Netflix and all the other would be 4K distributors have to acknowledge the elephant in the room. The amount of information that Ultra HD requires to be pushed through Internet service providers' pipes may prove too much for them to handle, at least in the near term. How does a 100GB-plus download for a typical movie sound?
So, in the meantime, getting consumers to shoot their own 4K productions on a Sony 4K camera equipped smartphone may be the company's best -- if not only -- selling point for their Ultra HD TV sets. At least for now.
There is no question that the television landscape is changing quickly, and not just for the television set makers. Streaming content from entrants such as Netflix and Amazon.com have disrupted traditional networks and the cable operators. The Motley Fool's new free report "Who Will Own the Future of Television?" details the risks and opportunities in TV. Click here to read the full report!
Tuesday, April 22, 2014
The GOP’s Uphill Fight for the White House
Though Republicans are well positioned ahead of this fall's congressional races, two key factors may make the 2016 presidential election a different story, as they try to keep Democrats from extending their two-term hold on the White House for the first time since 1930.
See Also: As Congress Dawdles, States Take Policy LeadFirst, the primary election schedule means it's unlikely GOP voters will come to an early consensus. Republicans in four states that vote early in the process have large blocs of motivated conservatives. These voters are inclined to support candidates who lean to the right rather than more mainstream candidates, who tend to win the nomination.
So moderate or less conservative Republicans are forced to run to the right during the primaries, spending money and enduring attacks that leave them in a weaker position than they would be otherwise after winning the nomination and heading into November's general election. This happened to former Massachusetts Governor Mitt Romney in 2012 and to Senator John McCain of Arizona in 2008.
This time around, former Florida Governor Jeb Bush is the poster child for the GOP's battle between principles and political expediency, where the central question is whether the party should nominate someone whose positions on every issue appease conservatives or a person who has a better chance of beating a Democrat in November.
Bush's view on immigration is softer than some conservatives want, and it may complicate his path to the nomination if he chooses to run. The irony: Those same views would help the GOP attract independents and Hispanics in the fall of 2016 — if Bush can get that far.
While Republicans fight over the nomination, Democrats will be able to conserve money and hone a united message for the general election. The party has essentially cleared a path for former Secretary of State Hillary Clinton to breeze to the Democratic nomination if, as expected, she joins the race.
Vice President Joe Biden badly wants to move up to the top job, but he knows he can't beat Clinton in the primaries and won't run unless she opts out. The same goes for most other would-be candidates. Someone will challenge Clinton, but it won't be a top challenger with a boatload of money, and the race to the nomination will be over quickly.
The other hurdle for Republicans in 2016: the Electoral College map. Democrats hold an edge in voter registration nationally and, more importantly for the presidential race, in most states with large populations. These include California (55 electoral votes), New York (29), Illinois and Pennsylvania (20 each) — states that Democrats usually carry.

The votes from those states, plus the District of Columbia and a dozen other states that tend to back the Democratic candidate, give a Democrat some 200 electoral votes, well on the way to the 270 needed to win.
Among populous states, Republicans can count on only the 38 electoral votes of Texas. Their candidate must carry all of the GOP's strongholds — mostly smaller states in the South and Midwest with fewer electoral votes — and most of the toss-up states to overcome the Democrats' Electoral College advantage. They can do that, for sure, but it's a tall order.
Republicans have to hope that President Obama's approval ratings stay low and that pointed oversight questions from House Republican committee chairmen on Obamacare, Benghazi and Russia, for example, put Clinton on the defensive.
For now, Clinton starts as a narrow favorite. If the Republicans can avoid a heated ideological battle over the next 24 months and can rally quickly behind a strong candidate, they may be able to win a couple of toss-up states and turn the Electoral College tide.
But based on the behavior of GOP voters in recent electoral cycles and the internal criticisms of Jeb Bush this month, there's little reason to expect Republicans to have a drama-free, fight-free primary season.
How Grocery Delivery Can Save You Time and Money
 Mario Tama/Getty Images
When my husband and I lived in New York City, we became spoiled. Every two weeks, a truck would show up to our second-floor walkup, and a strapping young man would deliver fresh groceries to our door. How did we get sucked into such a luxury? FirstDirect, the city's top grocery deliverer, was offering a promo for first-time customers, and Johnny and I decided to give it a try. We found that promo or not, having our groceries delivered was comparable and often cheaper than shopping at our local grocers. No more carrying groceries five blocks as each of our fingers slowly lost circulation? Yes, please. While grocery delivery may currently only be the norm in metro areas, soon it may be an option for you. And you. And you. Amazon.com (AMZN) and Walmart Stores (WMT) have recently joined the grocery delivery industry. While AmazonFresh was only available in Seattle just a year ago, it has now expanded to San Francisco and Los Angeles. Before you shrug this off as a modern-day fairytale (delivery by drone?) or just an unnecessary extravagance, consider the following reasons grocery delivery could save you money -- and most definitely time: No More Impulse or Distracted Purchases Oreos on a screen are much less tempting than an actual package in a grocery store. Marketers spend millions of dollars figuring out the most effective ways of tempting you while you browse the aisles. By shopping online, you can stay focused on the shopping list. And you won't have a toddler screaming and grabbing items off the shelf as you struggle to compare prices on salad dressing.
Comparable Prices However unbelievable it may seem, prices for delivered groceries tend to be comparable to local grocers. And just like local grocers, delivery services offer coupons, weekly specials and price matching. Some companies even waive the delivery fee once your total reaches a certain amount. My husband and I made a habit of only ordering if we had a coupon for free delivery, which happened regularly. No Travel Expenses Grocery delivery eliminates the costs incurred for traveling to and from the grocery store, which means no more money spent on gasoline or a cab fare. And the opportunity cost of avoiding the grocery store means you can do your shopping while watching Jimmy Fallon at night. Knowing the Total Before You Buy I try to add up how much my groceries are going to cost as I shop in brick-and-mortar stores, but inevitably I lose count or get distracted. With online grocery shopping, you can see the total before you confirm your order. And that means you can check and double check whether each item is really necessary. It's both more difficult and less likely to go back on purchases that have already been rung up by a cashier. While currently only a handful of cities have grocery delivery, within the next 10 years, it might be an option for most of the country. And when that day comes, you can bet that my wallet and I will be first in virtual line to have groceries delivered to our door, drone and all.
Top 5 Trucking Companies To Watch In Right Now
So quality and ability to execute are not problems. What is the problem is estimating fair future growth rates. It seems hard to imagine that Cummins can match its trailing revenue growth rate of 12%, but countries like Brazil, China, and India are still seeing trucking operators building their fleets, while the move to natural gas could fuel demand not only for LNG/CNG engines, but also compression facilities and more equipment for the energy sector. Although I think the Street may be a little too optimistic on the free cash flow margin leverage Cummins can deliver, I'm increasingly thinking this is a good stock to own for the longer term.
Top 5 Trucking Companies To Watch In Right Now: Clicksoftware Technologies Ltd (CKSW)
ClickSoftware Technologies Ltd. (ClickSoftware), incorporated in 1979, is a provider of software products and solutions for workforce management and optimization for the service sector. The Company derives revenues from the licensing of its software products and the provision of consulting and support services. It also generates revenues from Cloud-based solutions. under software as a service (SaaS) model. ClickSoftware�� solutions are grouped into four main suites which together comprise its Service Optimization Suite: Field Service Daily Suite, Mobility Suite, Roster (Shift Planning) Suite and Forecasting and Planning Suite. Additionally, it offers variations of its products for certain vertical markets, including Mid-Market Package - Installation, Maintenance and Repair Services (ClickIMRS) and Service Tycoon. Its products include: ClickSchedule, ClickAnalyze, ClickLocate, ClickContact, ClickRoster, ClickPlan, and ClickForecast. In March 2014, the Company acquired Xora Inc., a cloud-based mobile workforce management.
Field Service Daily Suite covers automatic decision making and optimization support to manage field service operations: commencing from appointment booking and scheduling during the period around the day of service, followed by real time scheduling and optimization during the day of service and culminating with reports and business metrics analytics after the day of service. Roster (Shift Planning) Suite covers shift planning needs for both the manager, as well as the employee to optimize the balance between staffing levels needed for serving customers and managing labor costs, and employee preferences. This suite is offered in several configurations for different industry verticals ranging from police forces to contact centers, and more. Mobility Suite covers the needs of the mobile individual and back-office staff for field data communication, such as sending jobs from the back office to the person�� hand-held device, and the person�� ability to accept/decline the ! job, report on progress and job completion, as well as capturing customers��signatures, or sending the person�� own time sheet to the back office. Geography support, such as travel guidance and information about underground equipment are also covered.
ClickSchedule optimizes service scheduling and routing to improve workforce productivity by balancing customer, service and asset resources, and organizational preferences, including contractual commitments, priority, drive time, skills, and service and asset resources availability. ClickAnalyze provides reporting, monitoring and service business analytics for workforce performance measurement and strategic decision support. It enables analysis of key performance indicators, including resource productivity, operational costs, and responsiveness to customers.
ClickLocate (LBS) captures the location information of a field service engineer and/or his or her vehicle obtained via GPS or other technology and integrates it with ClickSchedule for use in optimized scheduling. LBS then enables service organizations to improve their service operations by allowing them to make decisions and take actions based on location information, including near real-time engineer locations. ClickContact is a customer interaction management solution that enables self-service appointment booking, order updating, automatic customer notifications and customer satisfaction surveying. From scheduling the initial appointment through enabling a post-service follow-up survey, ClickContact provides customer interaction management throughout the service lifecycle.
ClickRoster provides interactive and automated workforce shift planning based on forecasted workload by quantities and skill requirements, rules and regulations, working contracts, engineer skills, calendar and preferences. ClickPlan provides interactive and automated workforce planning for staffing and deployment of the field workforce based on forecasted workload. It is designed ! to enable! service organizations to resolve workforce shortages and surpluses weeks and months in advance. ClickForecast provides field service workload forecasting to enable companies to project workforce capacity. It enables service managers, marketing, and sales to determine the demand levels of customers, and to create multiple forecast scenarios, each with different business assumptions. (ClickIMRS) is a pre-configured package that has been tailored to the needs of small and mid-sized companies. ClickIMRS features pre-configured scheduling and reporting that reduces the expense, time and effort required to custom-design and program schedules and reports. In addition, the ready-to-use reports provide insight into service operations and streamline decision-making on the part of both service management and dispatchers.
ClickSoftware Cloud Services include two Web-based offerings of its complete Service Optimization Suite. ClickCloud offers medium and market enterprise customers an alternative to on-premises deployment of the Service Optimization Suite. ClickCloud also enables a hybrid information technology (IT) model, which is a solution comprised of a mix of Cloud and on-premises deployment ClickExpress offers the customers to be up and running within a relatively short period of time, with its products.
Advisors' Opinion:- [By Sean Williams]
Optimize your buying
Software companies these days are being judged not just by how many new contracts they gained during the current quarter, but by how well they're prepared to deal with the transition to cloud platforms. Supply-chain and workforce-optimization software developer ClickSoftware Technologies (NASDAQ: CKSW ) looks well poised to take advantage of these trends and has no business, in my opinion, being anywhere near a 52-week low.
Top 5 Trucking Companies To Watch In Right Now: SPDR DB International Government Inflation-Protected Bond ETF (WIP)
SPDR DB International Government Inflation-Protected Bond ETF (the Fund) seeks to provide investment results that correspond generally to the price and yield performance of the DB Global Government ex-US Inflation-Linked Bond Capped Index (the Index). The Index measures the performance of the inflation-linked government bond markets of developed and emerging market countries outside of the United States. Inflation protected public obligations of the inflation-linked government bond markets of developed and emerging market countries, commonly known in the United States as treasury inflation-protected securities (TIPS), are securities issued by such governments that are designed to provide inflation protection to investors. The Fund uses a passive management strategy to track the Index. The Fund�� investment advisor is SSgA Funds Management, Inc. Advisors' Opinion:- [By Richard Stavros]
With respect to inflation protected bonds, though TIPS should be a part of every portfolio. However, we believe the SPDR DB International Government Inflation-Protected Bond (WIP) offers greater protection than TIPS.
Top Food Stocks To Invest In Right Now: Arrium Ltd (ARRMF)
Arrium Limited is an international mining and materials company. The Company�� principal activities are mining and supply of iron ore and other steelmaking raw materials to steel mills internationally and in Australia; the manufacture and supply of mining consumables products globally; the manufacture and distribution of steel long products and recycling of ferrous and non-ferrous scrap metal. Its key businesses include Mining, Mining Consumables, Steel and Recycling. Arrium Mining is an exporter of hematite ore with operations in South Australia. Arrium Mining also supplies pelletised magnetite iron ore and some hematite lump iron ore to the Company�� integrated steelworks. Arrium Mining Consumables supplies resource companies with a range of key mining consumables, including grinding media, wire ropes and rail wheels. Arrium�� integrated Steel and Recycling include OneSteel Manufacturing, long products steel manufacturing business, and OneSteel Distribution. Advisors' Opinion:- [By MARKETWATCH]
LOS ANGELES (MarketWatch) -- Australian stocks rose modestly in early Tuesday trade, with the market reacting to a mixed batch of earnings. The S&P/ASX 200 (AU:XJO) added 0.2% to 5,391.80, with BHP Billiton Ltd. (AU:BHP) (BHP) rising 1.7% after its July-December profit almost doubled from a year earlier, beating forecasts. However, smaller rival Arrium Ltd. (AU:ARI) (ARRMF) added 2.5% after reporting a swing back to profit. Other miners got a bump up from rising commodity prices, as Newcrest Mining Ltd. (AU:NCM) (NCMGF) gained 2.3% and Fortescue Metals Group Ltd. (AU:FMG) (FSUMF) added 1.2%, though Oz Minerals Ltd. (AU:OZL) (OZMLF) slipped 0.4%. Shares of Coca-Cola Amatil Ltd. (AU:CCL) (CCLAF) slumped 5.1% after the drinks firm saw a more than 80% drop in 2013 profit, weighed by a writedown on its fruit-processing business. Packaging firm Amcor Ltd. (AU:AMC) (AMCRF) lost 4.6% after its fiscal-first-half profit fell by about a third.
Top 5 Trucking Companies To Watch In Right Now: NCR Corp (NCR)
NCR Corporation (NCR), incorporated on January 02, 1926, is a technology company, which provides products and services, which enable businesses to connect, interact and transact with their customers and enhance their customer relationships by addressing consumer demand for convenience, value and individual service. NCR�� portfolio of self-service and assisted-service solutions serve customers in the financial services, retail, hospitality, travel and gaming and entertainment industries and include automated teller machines (ATMs), self-service kiosks and point of sale (POS) devices, as well as software applications, which can be used by consumers to enable them to interact with businesses from their computer or mobile device. NCR complements these product solutions by offering a portfolio of services to help customers design, deploy and support its technology tools. NCR also resells third-party networking products and provides related service offerings in the telecommunications and technology sectors. The Company operates in four segments: Financial Services, Retail Solutions, Hospitality (formerly Hospitality and Specialty Retail), and Emerging Industries. Its product and service offerings include ATMs and Other Financial Products, Self-Service Kiosks, Point of Sale, Check and Document Imaging, Services, and Consumables. In June 2012, the Company acquired POS Integrated Solutions, a reseller of the NCR Aloha solution for restaurants; Wyse Sistemas de Informatica Ltda., a provider of software solutions, including the Colibri suite of hospitality software, and Radiant Distribution Solutions (RDS), a NCR Hospitality hardware distribution partner. In June 2012, Coinstar, Inc.�� wholly owned subsidiary, Redbox Automated Retail, LLC, acquired certain assets of the Company�� self-service entertainment DVD kiosk business. In November 2012, NCR acquired Retalix Ltd. In January 2013, the Company purchased uGenius Technology, Inc. In February 2013, the Company acquired Retalix Ltd. In January 2014, NCR Co! rp completed the acquisition of Digital Insight Corporation.
ATMs and Other Financial Products
The Company provides financial institutions, retailers and independent deployers with financial-oriented self-service technologies, such as ATMs, cash dispensers, and software solutions, including the APTRA application suite as well as consulting services related to ATM security, software and bank branch optimization. ATM and other financial product solutions are designed to quickly and reliably process consumer transactions and incorporate advanced features such as automated check cashing/deposit, automated cash deposit, Web-enablement and bill payment (including mobile bill payment).
Point of Sale
The Company provides retail and hospitality oriented technologies such as point of sale terminals, bar-code scanners, software and services to companies and venues worldwide. Combining its retail and hospitality industry, software and hardware technologies, and consulting services, its solutions are designed to enable cost reductions and improve operational efficiency while increasing customer satisfaction.
Self-Service Kiosks
The Company provides self-service kiosks to the retail, hospitality, travel and gaming, and entertainment industries and also owns and operates self-service kiosks in the entertainment industry. Its versatile kiosk solutions can support retail self-service functions, including self-checkout, wayfinding, bill payment and gift registries. It provides self check in/out kiosk solutions to airlines, hotels and casinos, which allows guests to check-in/out without assistance. These solutions create pleasant and convenient experiences for consumers and enable its customers to reduce costs. Its kiosks for the hospitality industry provide consumers the ability to order and pay at restaurants while enabling its customers to streamline order processing and reduce operating costs.
Check and Document Imaging
The ! Company�� check and document imaging offerings provide end-to-end solutions for both traditional paper-based and image-based check and item processing. These solutions utilize advanced image recognition and workflow technologies to automate item processing, helping financial institutions efficiency and reduce operating costs. Consisting of hardware, software, consulting and support services, its comprehensive check and document imaging solutions enable check and item-based transactions to be digitally captured, processed and retained within a flexible, scalable environment.
Consumables
The Company develop, produce and market a complete line of printer consumables for various print technologies. These products include two-sided thermal paper (2ST), paper rolls for receipts in ATMs and POS solutions, inkjet and laser printer supplies, thermal transfer and ink ribbons, labels, laser documents, business forms, and specialty media items such as photo and presentation papers. Consumables are designed to optimize operations and improve transaction accuracy, while reducing overall costs.
Services
The Company provides maintenance and support services for its product offerings and also provides other services, including site assessment and preparation, staging, installation and implementation, systems management and complete managed services. It also offers a range of software and services, such as Software-as-a-Service, hosted services, and online, mobile and transactional services and applications, such as bill pay and digital signage. In addition, it is also focused on expanding the resale of third party networking products and related service offerings to a base of customers in the telecommunications and technology sectors and servicing third-party computer hardware from select manufacturers.
The Company competes with Diebold, Inc., Wincor Nixdorf GmbH & Co., Hyosung, IBM, Wincor, Fujitsu, Hewlett-Packard, ToshibaTec, Dell, Honeywell, Micros Syste! ms, Verif! one, Datalogic, SITA and IER.
Advisors' Opinion:- [By Lauren Pollock]
NCR Corp.(NCR), a maker of automatic teller machines, has agreed to pay $1.65 billion to acquire outsourced online banking firm Digital Insight Corp., a move to address rising consumer interest to bank across multiple channels.
- [By MARKETWATCH]
SAN FRANCISCO (MarketWatch) -- Wall Street hedge-fund investor David Einhorn was active in the last quarter of 2013, taking new stakes in technology and energy companies, while trimming existing holdings in insurer Aetna (AET) , NCR Corp (NCR) and WPX Energy (WPX) , according to an SEC filing Friday. Einhorn's Greenlight Capital picked up stakes in Anadarko Petroleum (APC) , BP (BP) , McDermott Intl. (MDR) , Micron Technolgy (MU) and Take-Two Interactive (TTWO) , according to the latest 13F filing. He trimmed stakes in Aetna, Einstein Noah (BAGL) and WPX Energy, according to the filing.
Top 5 Trucking Companies To Watch In Right Now: Bonanza Creek Energy Inc (BCEI)
Bonanza Creek Energy, Inc., incorporated in December 2010, is an oil and natural gas company engaged in the acquisition, exploration, development and production of onshore oil and associated liquids-rich natural gas in the United States. The Company�� assets and operations were focused primarily in southern Arkansas (Mid-Continent region) and the Denver Julesburg (DJ) and North Park Basins in Colorado (Rocky Mountain region) during the year ended December 31, 2010. In addition, it owns and operates oil producing assets in the San Joaquin Basin (California region). It operated approximately 99.4% and held an average working interest of approximately 85.8% of its proved reserves as of December 31, 2010. As of December 31, 2010, its net proved reserves was 32,860 million barrels of oil equivalent (MBoe).
The Company�� proved reserves and its drilling locations in its Mid-Continent acreage are located in the Dorcheat Macedonia field and the McKamie Patton field. In the Dorcheat Macedonia field the Company averages a 83.3% working interest and 68.5% net revenue interest, and all of the Company�� acreage is held by production. It had approximately 78 gross (65.0 net) producing wells and its average net daily production during April 2011, was approximately 1,249 barrels of oil equivalent per day (Boe/d) from a proved reserves base of 15,247 million barrels of oil equivalent, of which about 64.5% was oil and natural gas liquids. As of April 30, 2011, the Company had drilled 13 gross (10.2 net) wells. Immediately northwest of the Dorcheat Macedonia field, it owns and operates the McKamie gas processing facility, which processes all of the gas from the field. It owns additional interests in the Mid-Continent region near the Dorcheat Macedonia field. These include interests in the McKamie-Patton, Atlanta and Beach Creek fields. Its estimated proved reserves in these fields as of December 31, 2010, were approximately 1,947.8 million barrels of oil equivalent, and average net daily production du! ring April 2011, was approximately 239 barrels of oil equivalent per day.
The McKamie processing facility is located in Lafayette County, Arkansas and is located to serve its production in the region. The Company�� facility has a processing capacity of 15 million cubic feet per day (MMcf/d) of natural gas and 30,000 gallons per day of natural gas liquids. The facility processes natural gas and natural gas liquids, fractionates liquids into three components for sale, and sells four products at the facility's tailgate: propane, butane, natural gasolines and natural gas. It also owns approximately 150 miles of natural gas gathering pipeline that serves the facility and surrounding field areas and 32 miles of right-of-way crossing Lafayette County that can be utilized to connect the facility to other gas fields or future sales outlets. Natural gas is sold at the tailgate of the facility into a CenterPoint pipeline connection. Fractionated natural gas liquids are held on site and trucked out by the buyer, Dufour Petroleum. The McKamie processing facility had an average net output of 749 barrels of oil equivalent per day based on the facility contracts in April, 2011.
The two main areas in which the Company operates in the Rocky Mountain region include the DJ Basin in Weld County, Colorado and the North Park Basin in Jackson County, Colorado. The DJ Basin is a structural basin centered in eastern Colorado that extends into southeast Wyoming, western Nebraska, and western Kansas. Its operations in the DJ Basin are in the oil window of the Niobrara and as of December 31, 2010, consisted of approximately 42,698 gross (29,742 net) total acres. The Company�� estimated proved reserves in the DJ Basin were 8,402 million barrels of oil equivalent at December 31, 2010. As of April 30, 2011, it had a total of 141 gross (133.6 net) producing wells and its net average daily production during April 2011, was approximately 1,124 barrels of oil equivalent per day. The Company�� working inter! est for a! ll producing wells averages is 94.8% and its net revenue interest was approximately 76.5% in 2010. The Codell sandstone and Niobrara oil shale are blanket deposits in the DJ Basin.
The Company controls 47,003 gross (39,030 net) acres in the North Park Basin in northern Jackson County, Colorado. The Basin is divided into three principal opportunities: the North and South McCallum units and the non-unit acreage. The Company operates the North and South McCallum fields. The McCallum field covers 10,277 gross (8,606 net) acres of federal land with the majority of the oil production coming from a waterflood in the Pierre B formation and the carbon dioxide production coming from naturally flowing Dakota wells. Oil production is trucked to the market while carbon dioxide production is sent to a Praxair plant for processing and delivery to the market. In the North Park Basin, its estimated proved reserves as of December 31, 2010, were approximately 696.1 million barrels of oil equivalent, of which 100% were oil. Its average net production during April 2011, was approximately 140 barrels of oil equivalent per day. All of the Company�� 47,003 gross (39,030 net) acres in the North Park Basin are prospective for the Niobrara oil shale.
In California the Company owns acreage in four fields: Kern River, Midway Sunset and Greeley, which the Company operates, and Sargent, which it does not. Its estimated proved reserves in California were 886 million barrels of oil equivalent at December 31, 2010. As of April 30, 2011, we had a total of 57 gross (48.7 net) producing wells and its average net daily production was approximately 218 barrels of oil equivalent per day. Its working interest for all producing wells averages 85.4% and its net revenue interest is approximately 71.9%. As of December 31, 2010, it had identified approximately 18 gross (13.6 net) PUD locations in California.
Advisors' Opinion:- [By Holly LaFon]
Another area that is intriguing to us is the North American energy sector which looks to have a number of interesting catalysts currently. While the energy sector is at present only a modest overweight in the portfolios, we have been encouraged by several trends taking place for a number of years. These positive developments are also having an impact that goes far beyond the energy sector itself. Many believe that the U.S. will become energy independent and possibly a net exporter of natural gas and oil (currently restricted by law) in the next decade. This opinion is based primarily on the development of new drilling techniques (i.e. horizontal drilling, and high pressure fracking) that have enabled companies to access oil and natural gas reserves in shale formations that were previously not economically viable. The ability to tap into this acreage is a game-changer in our view and is already having a tremendous impact on the economy. Employment rates in these mostly rural areas surrounding the shale basins are very high and companies thus find hiring extremely competitive. Strong labor markets tend to create strong local economies. Oil States International (OIS) has been able to capitalize on this trend by providing housing and other services to oil service workers that are in demand in the area. CST Brands (CST) operates gas stations in Texas, but it is increasingly looking to broaden its product offering beyond fuel. Rail companies like Union Pacific (UNP), Canadian Pacific (CP), Kansas City Southern (KSU) and Genesee and Wyoming (GWR) have also benefited substantially. Given that shale areas are rural and often lacking infrastructure, substantial investment must be made to support drilling and production activities. Without pipelines in place, railroads have been the primary takeaway mechanism for moving production to the various clusters of refining capacity around the United States. In order to serve this demand, massive investment in railcars has been nee